Abstract
This report covers the testing (second) phase of the Fusion Planetary Explorations Project, where we investigate a celestial body suitable for inhabitation and build a solution to do so. This page outlines the testing intentions, the process of designing and building our prototype, the collected data, and an analysis of our test results.
Definition Statement
Our chosen location for the Fusion Planetary Exploration Project was Titan, Saturn’s largest moon. We chose this location due to the many opportunities it brings in natural energy, oxygen, and atmosphere. However, some challenges must be addressed for permanent inhabitation.
When designing a vehicle suitable for Titan, the critical problems we must consider are its ability to accommodate 4 people and its machinery under extreme temperatures of -180°C, hold sufficient energy to travel distances of 10km at a time, be able to produce oxygen, and have sufficient traction to grip Titan’s unique surface of ice, dunes and pebbles alongside combating the lower gravity similar to the moons.
Purpose of Test
The intentions of our test include two main points:
- The effectiveness of spiked treads on different terrains, namely, on soft and slippery terrain, to imitate the deserts and ice sheets that cover Titan.
- Distance testing, to understand if our prototype’s motors can complete a sufficient distance that, when scaled to the intended size, can drive a continuous 10 km trip.
Based on this data, we aim to find the efficiency of our motors and the energy needed to power them. This will be done with the help of the video analysis lab. We intend to adjust our design based on this data, mainly by taking into consideration how scaling our prototype may affect performance. For example, how the real design’s weight affects the tread’s effectiveness on sand.
Test Apparatus
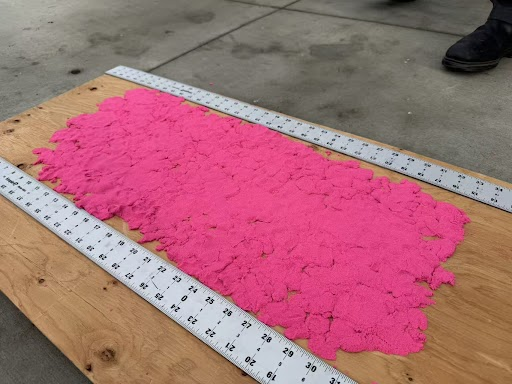
The tests for our prototype intend to imitate the vast deserts and ice sheets that cover Titan. Our desert environment will likely be a large pillow or soft mattress, as they are easily compressed under heavy weight. If accessible, an area of real sand, large enough to imitate dunes, will be used for the most accurate results. The shifting surface caused by this compression test tests how our vehicle’s treads and spikes perform to keep the vehicle stable. The icesheets can be mimicked using a clean whiteboard, or if unrestrained by budget, with ball bearings. This environment tests our tires’ traction and their ability to traverse slippery surfaces. Our final testing apparatus is shown below.

Prototype Design – Vehicle Body
The CAD designs below showcase the initial design of our vehicle’s main body. We originally decided on a rectangular body, where all the mechanical components, such as motors, batteries, Arduino board, etc., would be stored. A hexagonal head is attached to this body as the main control center for the vehicle.
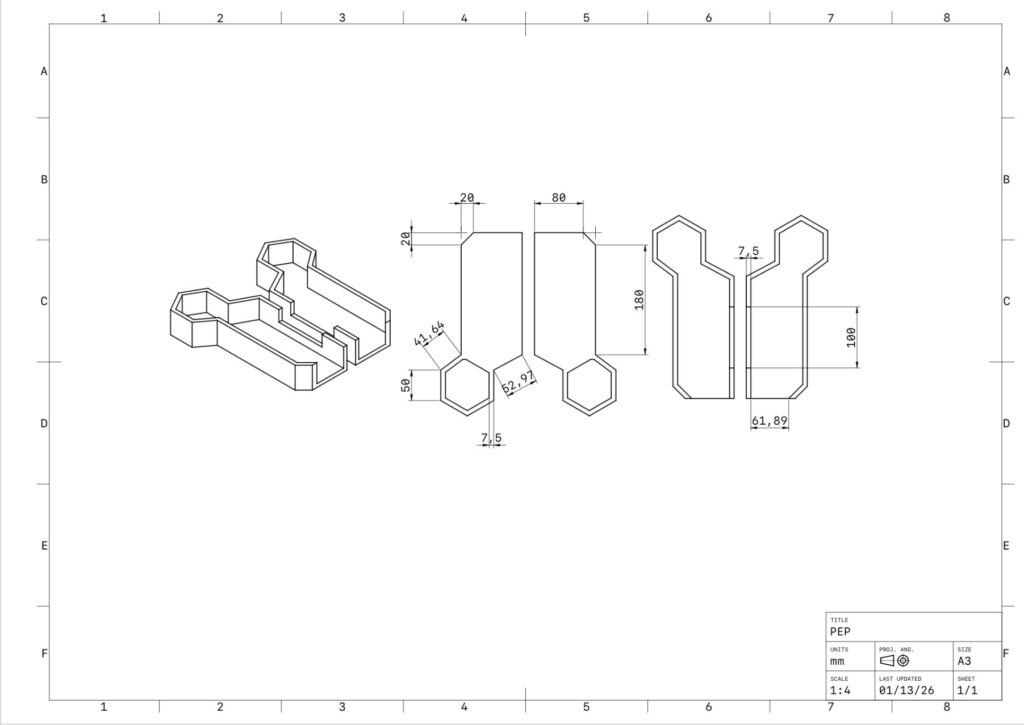
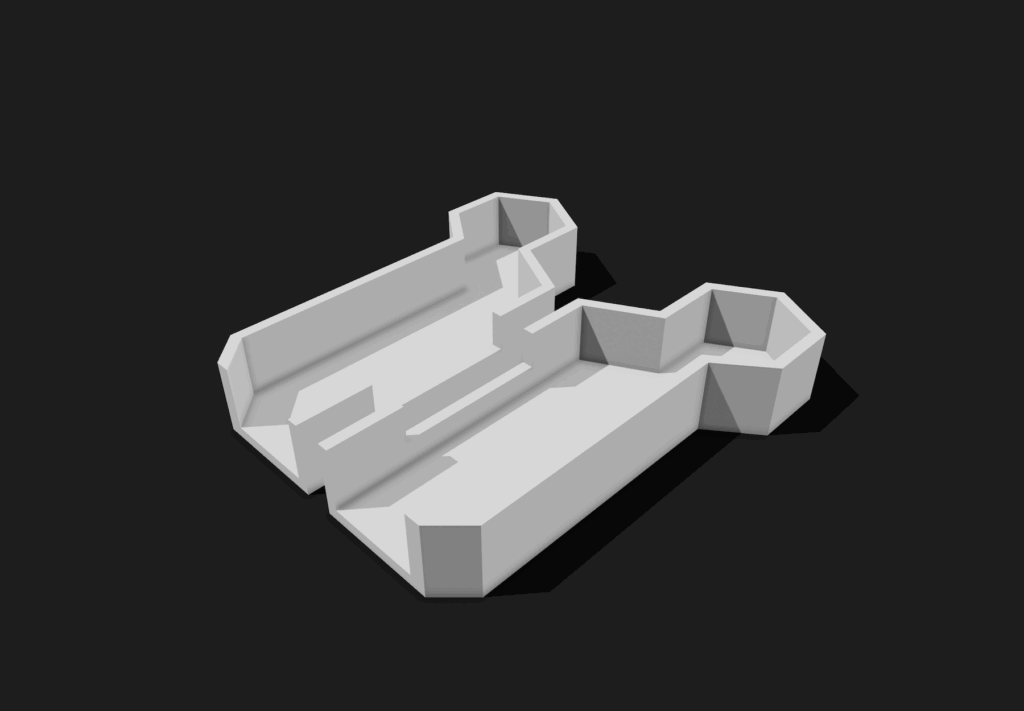
The primary issue we encountered with the initial design of the vehicle body was that it was too large and complex for efficient testing. The roof of the vehicle covered the mechanical components, making it difficult to adjust our Arduino, while the head of the design served no purpose in the prototype itself. Based on these issues, we redesigned our vehicle body to be lighter and simpler, boasting only a rectangular frame with an exposed roof for easy access to adjusting our Arduino. The simpler design also allowed us to reprint the body if necessary.
Prototype Design – Arduino System
The designs below showcase the initial design of our vehicle’s Arduino system. A motor driver acts as the motherboard of the system. This motor drive is connected, through the breadboard, to the power pin on the Arduino board. Four motors are attached to the motor driver to power the 8 wheels that make up our original treads. Lastly, a button is wired into the system such that when pressed, the four motors run simultaneously, as this allows for easy control in the testing environment.
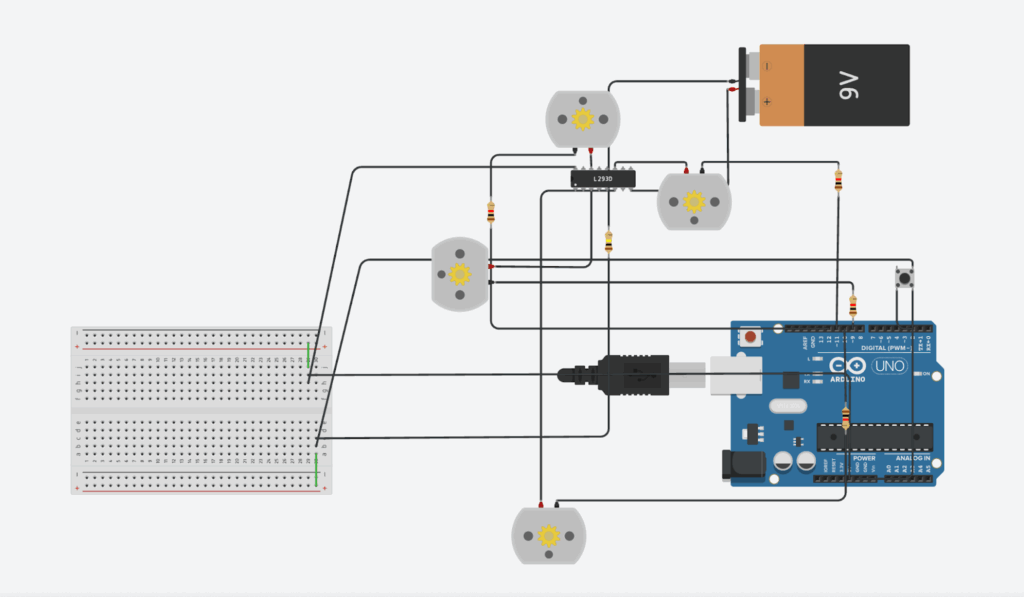
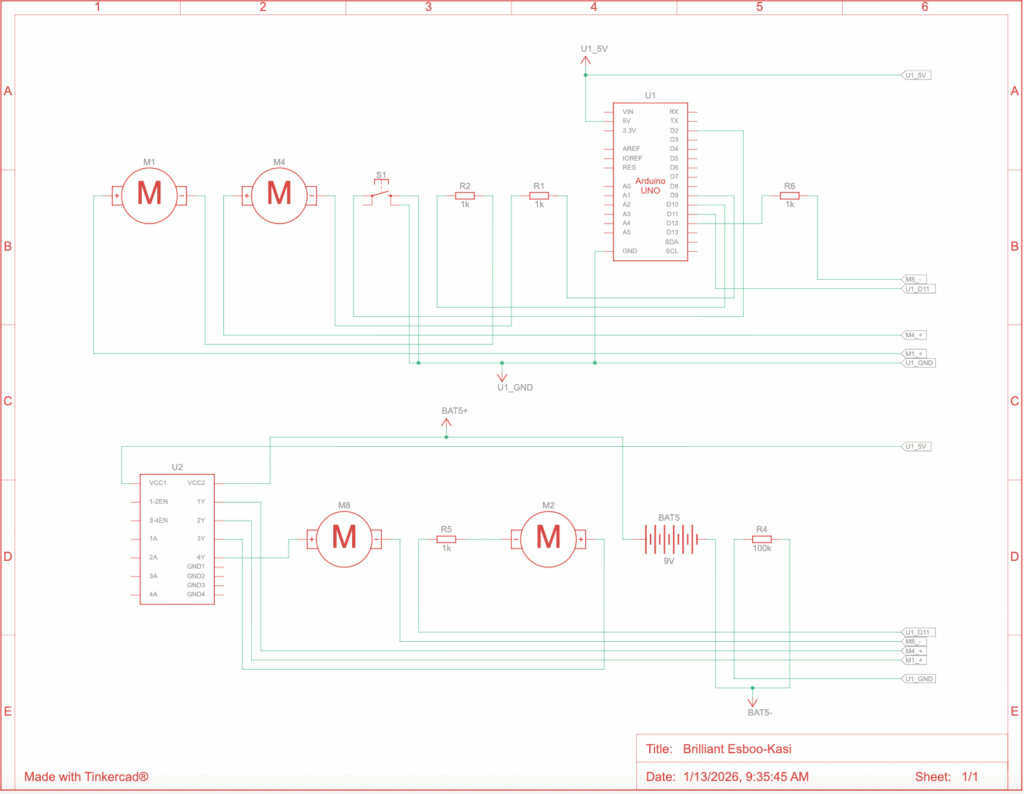
The full Arduino code for this system is attached below.
int buttonPin = 2;
int motor1 = 9;
int motor2 = 10;
int motor3 = 11;
int motor4 = 12;
// assigning the motors and buttons to pins on the Arduino Board

bool motorState = false;
bool lastButtonState = HIGH;
// setting up variables to detect button and motor state

void setup() {
  pinMode(buttonPin, INPUT_PULLUP);
  pinMode(motor1, OUTPUT);
  pinMode(motor2, OUTPUT);
  pinMode(motor3, OUTPUT);
  pinMode(motor4, OUTPUT);
}
// connecting the input and output of motors to button clicks

void loop() {
  int reading = digitalRead(buttonPin);
  // detect a button press through its state (high/low)

  if (reading == HIGH && lastButtonState == LOW) {
    motorState = !motorState;
    delay(50);
  }
  // set the motor state to true if button press is detected

  lastButtonState = reading;

  // power the motors if the motor state is true
  digitalWrite(motor1, motorState ? LOW : HIGH);
  digitalWrite(motor2, motorState ? LOW : HIGH);
  digitalWrite(motor3, motorState ? LOW : HIGH);
  digitalWrite(motor4, motorState ? LOW : HIGH);
}
Our Arduino system faced difficulties in obtaining sufficient battery power to run effectively. The digital design on Tinkercad differs slightly from the physical design, mainly in the battery voltage and the number of connections that could be made to a single pin. From this issue, we decided to simplify the Arduino design to be a minimum viable product (MVP), as the system itself is not the primary focus of our tests.
Initial Testing
The main issue our initial test encountered was securing the treads onto our wheels. Our original design was set up to use 3D-print filament to print our wheels, tape around the wheels to provide traction, and rubber treads. However, when assembling our prototype, we failed to consider how hot glue melts through such soft material. Due to this issue, we decided to edit the prototype to replace the treads with wheels. This was done in order to test the second intention of this experiment, which was to determine whether the motors provided sufficient energy to power the vehicle. The motors themselves worked to our expectations; however, a stronger material for the axle that replaces the original wooden ones may aid in transferring more of the motors’ power into the wheels themselves and provide more efficiency.
Final Design
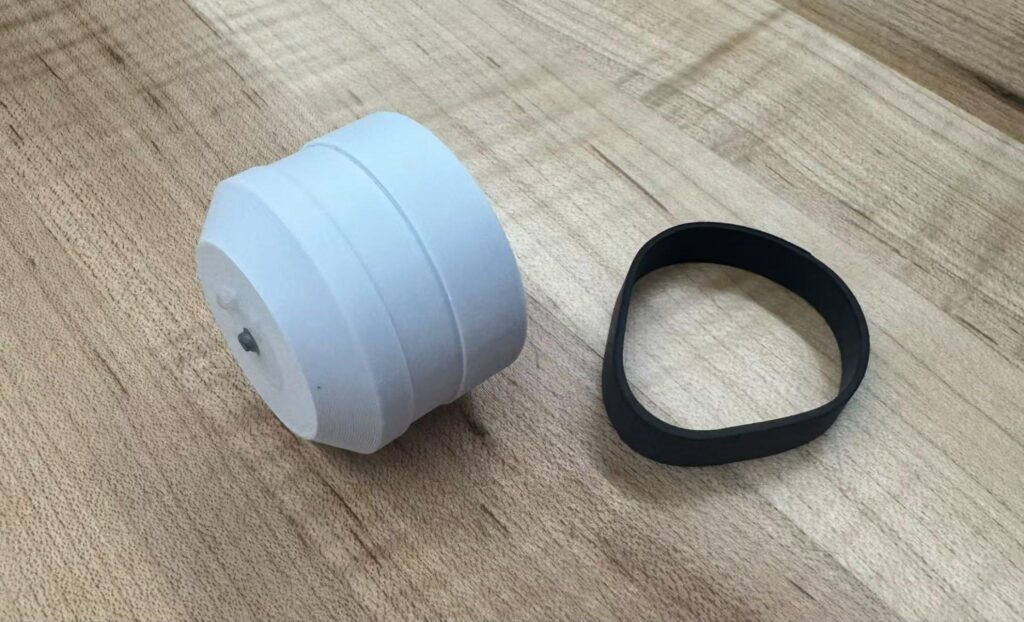
To address the issue we faced in the first prototype, where the rubber treads were too loose to attach and easily melted under hot glue, we redesigned the wheels to include an indentation for secure attachment. We decided to exchange the large treads for smaller, more elastic ones that would be fitted across each wheel instead of over four. This design allows for firmness without additional hot glue. We also replaced the original wooden axles with metal ones to prevent bending under the tighter treads.
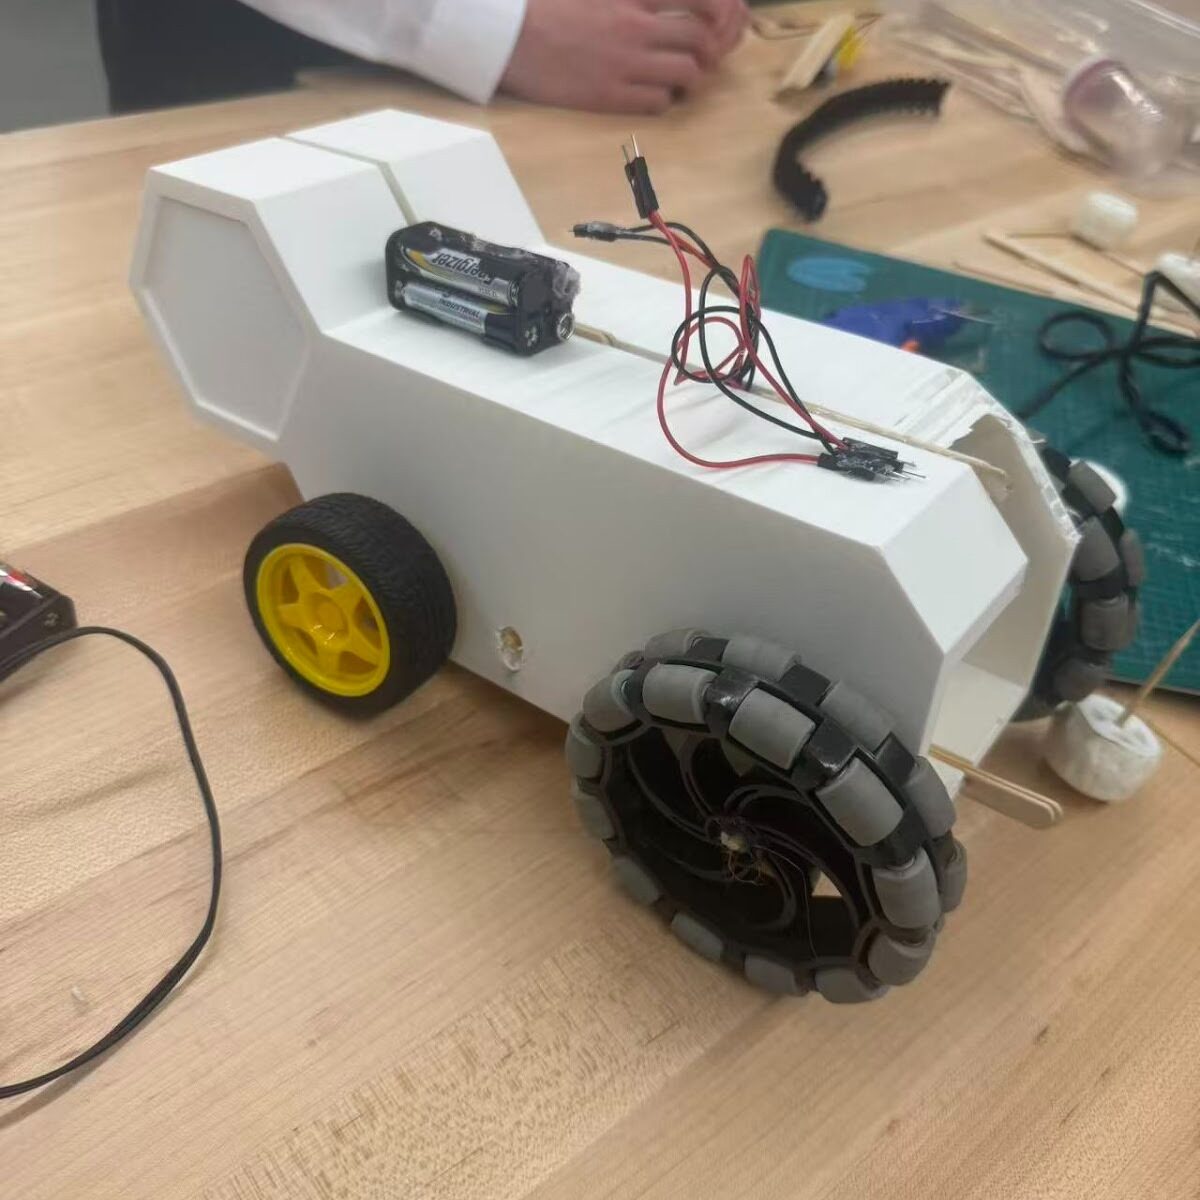
Our final design replaces the first prototype’s bulky vehicle body with a simpler model. We decided to remove the vehicle’s head, as it did not serve a purpose in our tests. The roof is exposed to allow easy editing with the Arduino and motors, and the laser-cut material provides for a lighter weight. A counterweight is also attached to the top of the vehicle to prevent toppling under the lighter load.
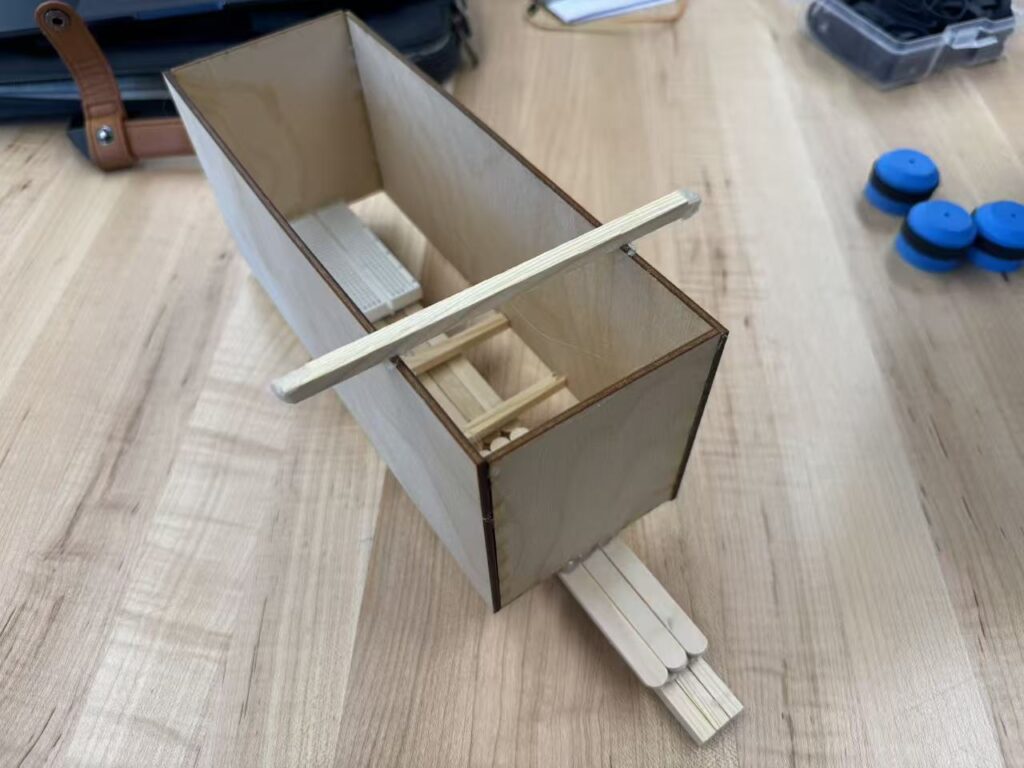
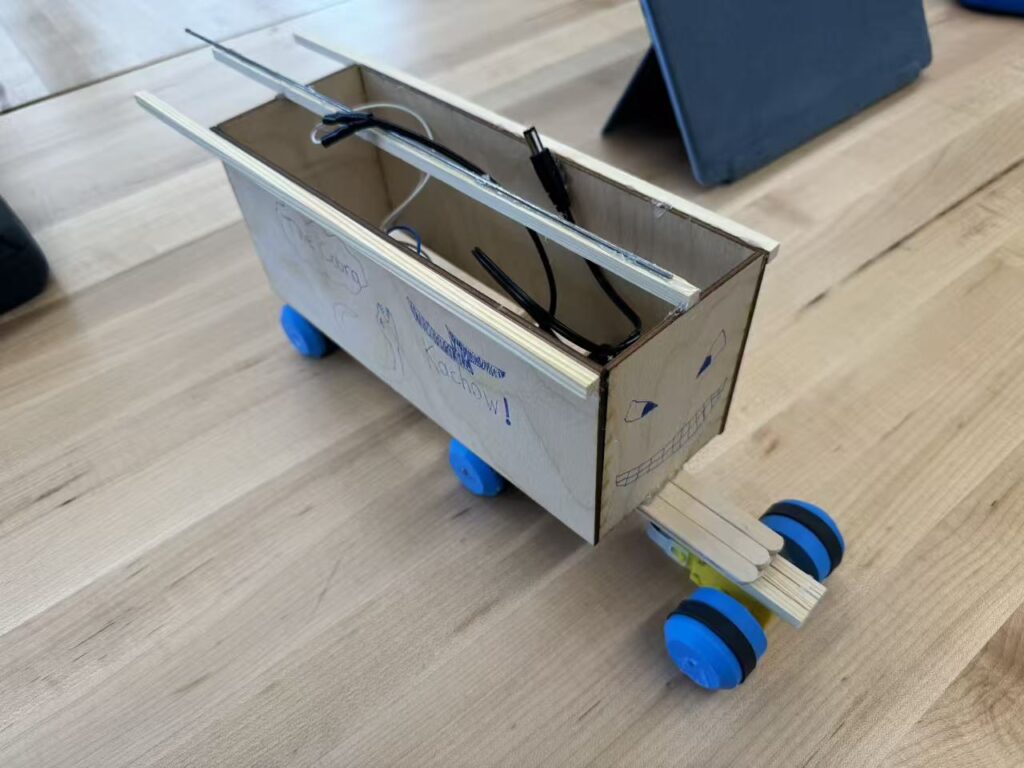
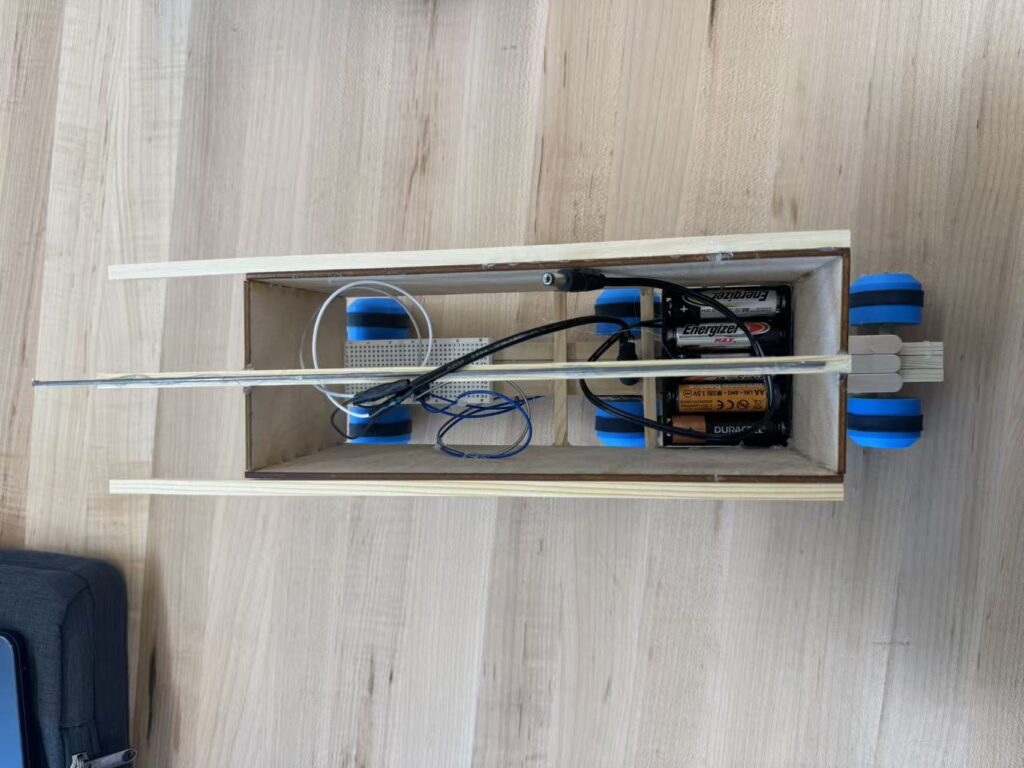
Our finished product combines the newly designed wheels and vehicle body with a new counterweight. The Arduino system is accessible inside the body, and the motors are attached below. The vehicle runs by connecting the two power cords, and is stabilized by the beams that extrude backwards. Our main considerations for the final design intend to keep the vehicle light and easily balanced, and for the wheels to be accessible on different terrains.
Additional photos of final prototype
Testing Day
The results of our second testing day have been attached below. The test followed our hypothesis, and the treads performed effectively against the different terrains. Due to its performance, we decided to run a test on a grassy terrain, where it was more rocky and uneven than the sand. This test acts as an indicator of how well the vehicle may run over large dunes, rock formations, and rugged surfaces. The test results were an overall success. Our vehicle faced minor instabilities while travelling over the terrain, but this issue was mitigated through the implementation of counterweights.
Additional Testing on Grassy Terrain
Data Collection
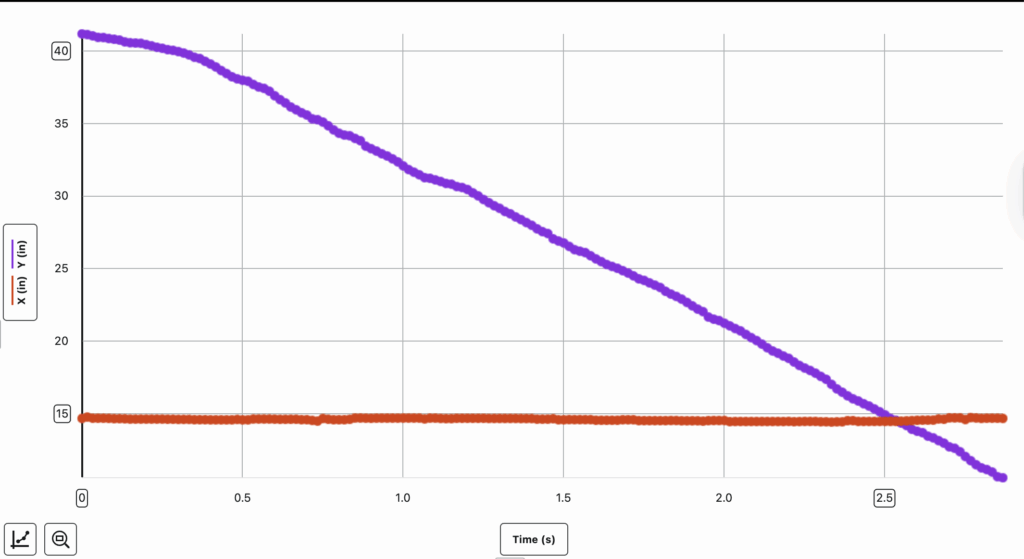
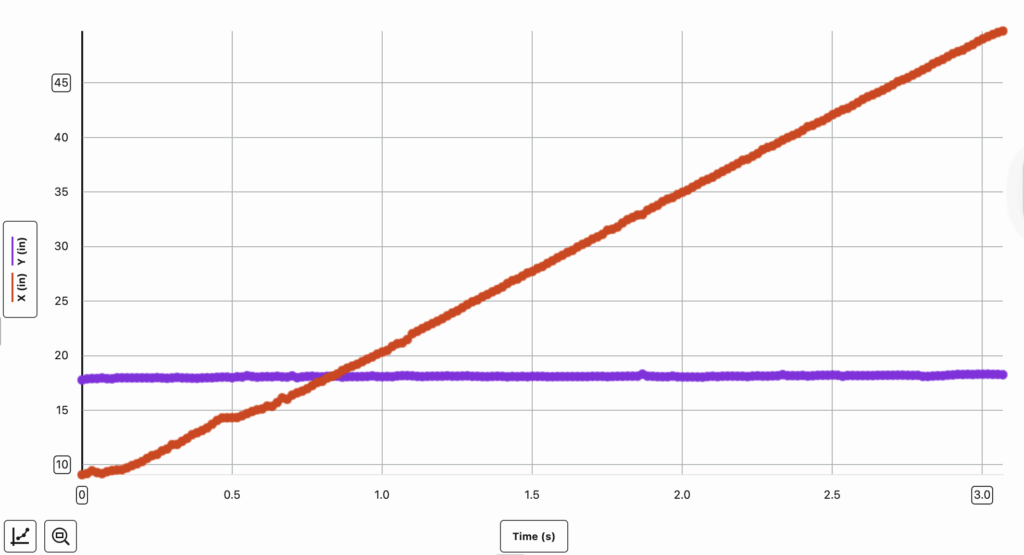
The goal of data collection is to find the efficiency of the vehicle. Using an ammeter and voltmeter, we found that the current and voltage of the vehicle were 0.52 Amps and 7.34 Volts, respectively. This data will act as the input for the vehicle’s efficiency, as it measures the energy the motors receive from the batteries. The mass of the vehicle was measured to be 506.7 g. Through the Vernier Video Analysis Lab, we were able to calculate the speed of our vehicle, finding it to be 0.28 m/s on sandy terrain and 0.34 m/s on icy terrain. This data will act as the output for efficiency.
Vernier Video Analysis Data
Sandy Surface Graph:
Icy Surface Graph:
Data Analysis
The main goal of our data analysis is to determine the efficiency of our vehicle, following the formula below:
Efficiency is expressed as a percentage. The input energy of our vehicle refers to the amount of energy, in Joules, applied to our system, which can be calculated by multiplying 0.52 Amps by 7.34 Volts. This equation results in approximately 3.82 Joules of energy being input into our vehicle. On the other hand, output energy is the total energy emitted by our vehicle. For our testing, no potential energy and minimal thermal energy in the form of friction are found. Thus, we can determine that the vehicle’s output energy is equal to its kinetic energy. The following formula can be used to calculate the vehicle’s total kinetic energy:
The “m” stands for mass in kg, which in our case is 0.5067 kg. “v” stands for velocity in meters per second. Because we conducted testing on two different terrains, we must find the average velocity of our vehicle across both experiments. This can be calculated by dividing the sum of the two velocities by the number of velocities recorded. The formula is shown below:
Through this formula, we find that the average velocity of our vehicle is approximately 0.31 m/s. Plugging these values of mass and velocity back into our formula for kinetic energy, we find that:
The output energy of our vehicle was found to be approximately 0.0243 Joules. Putting this value into our original formula for efficiency results in the equation:
Based on this equation, we can determine that our vehicle’s efficiency is approximately 0.637%.
Evaluation
Although this efficiency is quite low, it is reasonable considering the small scale of our project. During testing, the uneven terrain caused imbalance within our wheels, which affected their overall speed. Due to this, suspension presents itself as a suitable area of improvement in the future. Enhanced suspension allows our vehicle to better maintain stability, ensuring that energy is not lost without purpose, such as when the wheels cannot make contact with the floor while the vehicle is driving. When scaling the vehicle, it is important to consider reducing the weight of the vehicle where possible, and adjusting the power and number of energy sources on our vehicle to increase efficiency. Because of the increase in size and weight of a realistic model, friction will likely play a more significant role in our vehicle’s efficiency, whereas it could be disregarded in our smaller prototype. The increase in weight will also be affected by Titan’s lower gravity.
Conclusion
Our prototype design and testing were an overall success. We were able to determine that our vehicle performed differently on varying terrains, as shown in the change in velocity, but maintained relative stability across both environments. The initial testing allowed us to redesign our vehicle to boast a lighter, more accessible body and a simpler Arduino system, allocating more time and focus to the main purpose of testing. We determined the vehicle’s effectiveness on sandy and icy surfaces, reflecting that of Titan’s terrain. Moving into the future, we aim to conduct a greater quantity of minor testing for our projects, rather than large-scale ones that may be hard to adjust.
Leave a Reply