In our first Planetary Exploration Project, our team must design an efficient transportation method on a foreign celestial body, both without wasting excess energy and without wasting time, capable of a 5-kilometre-long round trip on Ganymede, one of Jupiter’s moons. This vehicle must handle extreme conditions including temperatures as low as -180C, low gravity(a tenth of Earth’s), rocky terrain, and interference from the planet’s magnetic field affecting electronics.
Our Solution
Vehicle
We chose a rover-like vehicle with focus on soft suspension and tires for improved traction.
To create the vehicle, we first had to decide on what the base would be, that is, the motors, tires and driveshaft.
We chose an RC car as a base as it seemed to be the most efficient. The RC car comes with a remote control and allows us to circumvent the necessity of a method of communication between the vehicle and the controller.
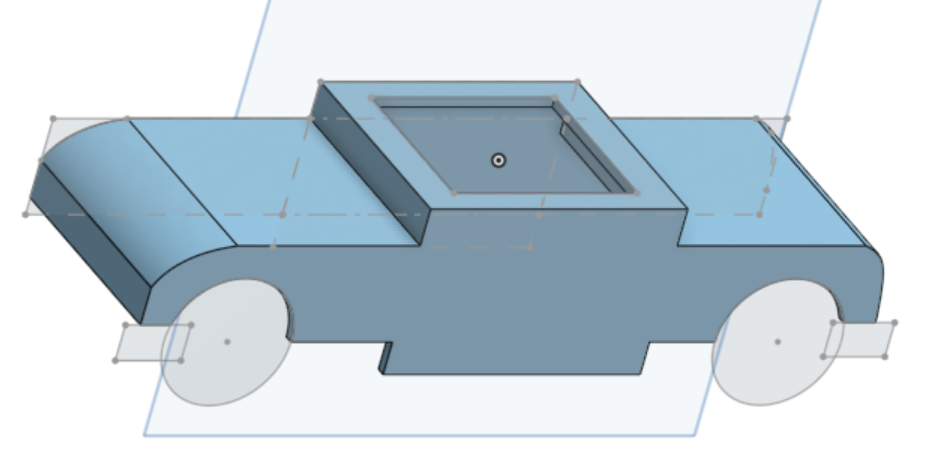
After the base, we had to create a shell for the vehicle, especially because we predicted that the sand and gravel would cause problems with the motor and tires.
Originally, we intended to use thrusters or fans to create “downforce” to improve the vehicles traction. However, the shell of the vehicle already heavy and we did not want to decrease the suspension travel distance.
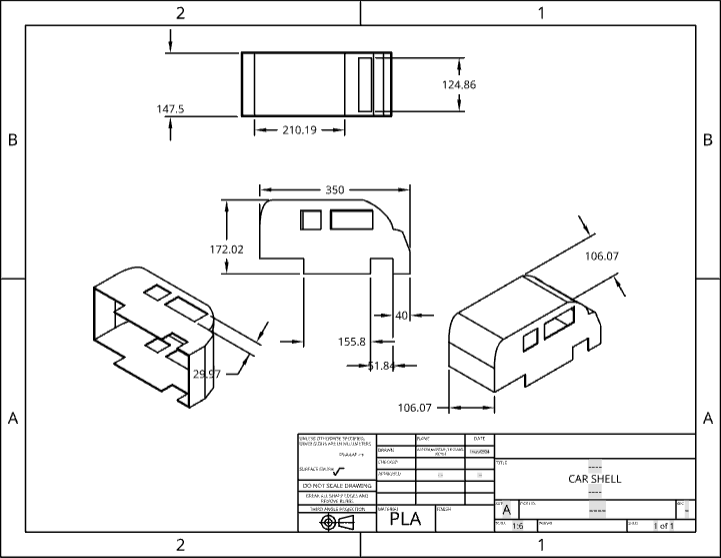
Using Onshape, we initially designed a van-like shape to leave space to add additional weight. This weight would help to increase the traction, a common problem seen in the HARD tests conducted. (Link at the bottom)
At the end, we decided on a sportscar-like shell. The sunroof opens an area to add weight and access the controls on the vehicle, and the shape is intended as a shield that can push sand and gravel out of the way rather than keep have it pile onto the hood.
Tests
Testing Ground
To test the vehicle, we’ve decided on using sand and gravel to mimic the terrain of Ganymede. We will be building obstacles, hills, and craters to test the vehicle’s maneuverability and ability to offroad.
Some tests to be conducted in the future would be extensive radiation and extreme cold testing. The strong magnetic field and freezing temperatures (~-150°) discovered on Ganymede could prove troublesome for our current method of operation.
Results
During the test, we made three different difficulties of terrain, boasting craters, large hills, and “zones” that the vehicle must maneuver around. Afterward, we took the average of multiple runs, driven by multiple people, to determine how long it would take to traverse the course.
Afterward, we compared the time taken by each track to the “control”. Furthermore, we had also planned to measure the battery drained by each “run” and compare it with the “control” once more. However, the voltmeter test was inconclusive as the distance driven did not have a significant impact on remaining charge.
Data gathered can be found here: Vehicle Testing Data
Analysis
First, lets calculate the average time taken by the control tests.
By excluding the anomaly control test, we get the equation for the mean as
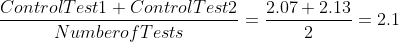
As speed is distance over time, average speed is average distance over average time. Let’s calculate the control tests’ average speed.

Now, divide the average distance by the average time.

Repeat with Easy, Medium, and Hard tests
Easy:

Medium:

Hard:

Control Tests (Videos 1 and 2):
The control tests are very consistent and demonstrate the vehicle’s capability of driving over “ideal” terrain. The average speed throughout provides a benchmark to compare the rest of the tests to. This is equivalent of the “Maximum” speed possible.
Easy Tests (Videos 4, 5):
Terrain A presents moderate difficulty, focused mostly on maneuverability around craters. The craters were not made to size, but rather as obstacles representing larger ones, such as mountains, boulders, and other obstacles. There is a noticeable speed decrease, like a result of the vehicle being forced to travel a longer distance as opposed to the terrain limited the vehicle’s speed.
Medium Tests (Videos 7, 8):
The variation in time and distance for Terrain B tests shows more difficulty. This terrain includes more complex features like larger obstacles and steeper inclines. This time, we drove the vehicles over the obstacles as opposed to around them. The vehicle excelled in these tests, even outperforming the maneuverability tests(Easy Tests) in average speed. This can likely be attributed to the vehicles suspension and traction being used alongside the vehicles maneuverability.
Hard Tests (Videos 6, 9, 10*):
The hard terrain is by far the most complex, with a focus on traction and suspension. The vehicle faces difficulty maintaining stability and speed and is reflected by a steep decrease in average velocity compared to previous tests. Steep inclines and uneven surfaces, pose substantial challenges to the vehicles abilities to climb with the tires slipping at multiple points throughout the test. Enhancements in suspension and stability features, like a roll cage, are crucial for improving performance in such demanding conditions.
Hard Test (Big Hill) (Video 10):
The Big Hill test took the longest time. This result is expected due to the steep incline, causing the vehicle to tip over and lose stability. The performance in this test highlights the need for targeted improvements to handle steep inclines effectively, ensuring the vehicle can navigate such terrains without compromising safety and efficiency.
Efficiency will be measured through the equation:

For the Easy Tests, it would look like:

Repeating for Medium and Hard Tests.
Medium:

Hard:

From this data, found here, we can discover the vehicle’s strengths and weaknesses.
Easy Tests:
Unsurprisingly, the vehicle has extremely strong maneuverability with its four wheel steering, and is reflected upon its excellent efficiency. I believe much of the efficiency lost to be due to the increase in overall distance driven rather than the motor’s limitations in respect to the terrain.
Medium Tests:
As a result of the efficiency of the medium tests, it further support my belief in the previous tests that the vehicle is not at all limited by the traction and power in the easy and medium tests. The vehicle was able to drive over the small craters marginally faster than it was to drive around them.
Hard Tests:
The hard tests highlight the limiting factor of the vehicle. Though video analysis, we discovered that the vehicle traction failed much faster than the engine did. The car tires slipped as it moved up the hill, dramatically limiting the vehicle’s efficiency.
Conclusion
Overall, I am happy with the efficiency that the vehicle displayed. Despite the challenging conditions, the vehicle performed above our expectations and continued to perform despite any challenges that we decided to try with it. The big hill was an idea for a course that would be built to be more and more difficult until the vehicle was nearly or completely unable to navigate it. In the videos, you can see the vehicle struggling to move upward, even carving out sections of the hill to create “footholds” for the tires.
To enhance the vehicle’s performance, I would upgrade the suspension and install a roll cage to improve its interaction with the terrain. Our tests revealed that the vehicle had difficulty navigating challenging terrain swiftly. Specifically, the massive hills posed a significant challenge due to their steep inclines. As the vehicle attempted to ascend or descend these hills, it often began to tip over, or the tires would slip, compromising its stability and maneuverability. Therefore, addressing these issues is crucial for improving the vehicle’s capability to traverse such demanding terrain safely and efficiently.
AI disclosure statement.
Ai was used in creating the table found here as well as formatting the equations only for efficiency found in the analysis component.
Leave a Reply to mcrompton Cancel reply