Introduction
As a recap, this project tasked me, along with my two partners, to design a vehicle capable of traveling a total distance of 5 kilometers, driving between two distinct points on the surface of any planet or celestial body of our choice. We decided on Ceres, a dwarf planet in the middle of the main asteroid belt between the orbits of Mars and Jupiter.
Our original testing plans were meant to show how our design was better suited for Ceres’ unique terrain and more efficient than a traditional car design, although our test plans had to be changed later on.
Throughout prototyping, building, and testing, we ran into many issues that we had to adapt to, but the final product is something I still think looks really cool and is worth celebrating.
–
Method & Procedure
We went with our design almost exactly from our prototyping stage and didn’t change much. One thing we did change, though, is the original suspension system. We originally planned for it to have springs to lift it up on legs, with the wheels attached, but we switched it out for a much easier mechanism when actually building it.
Our CAD model of our initial plans was this:


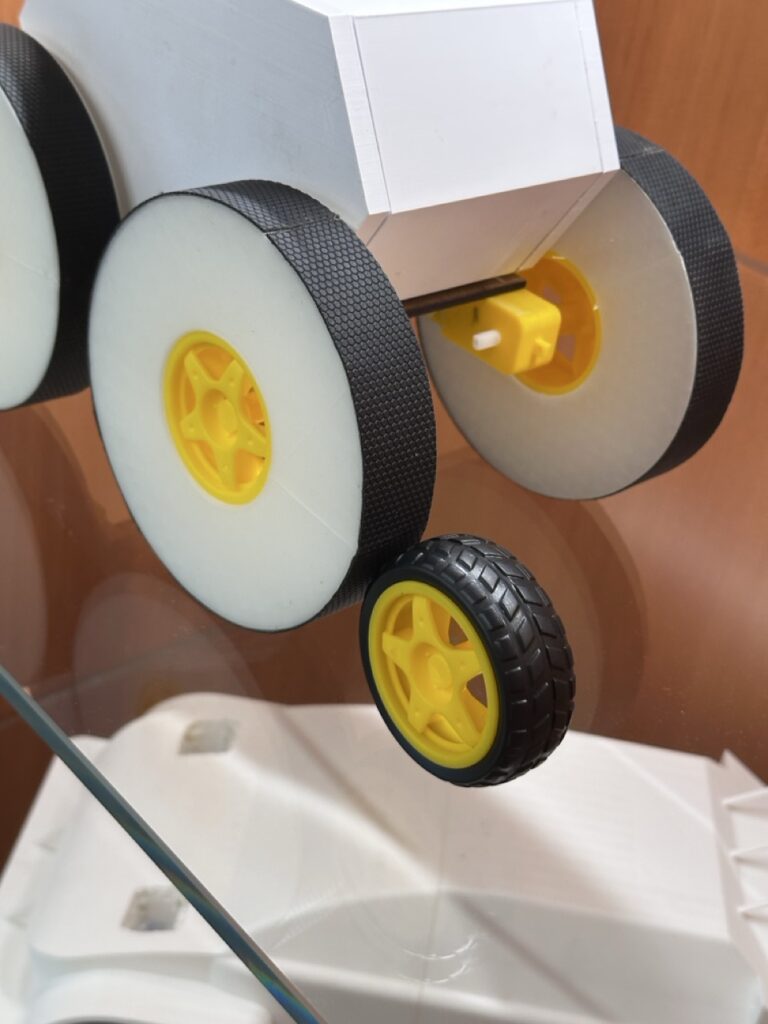
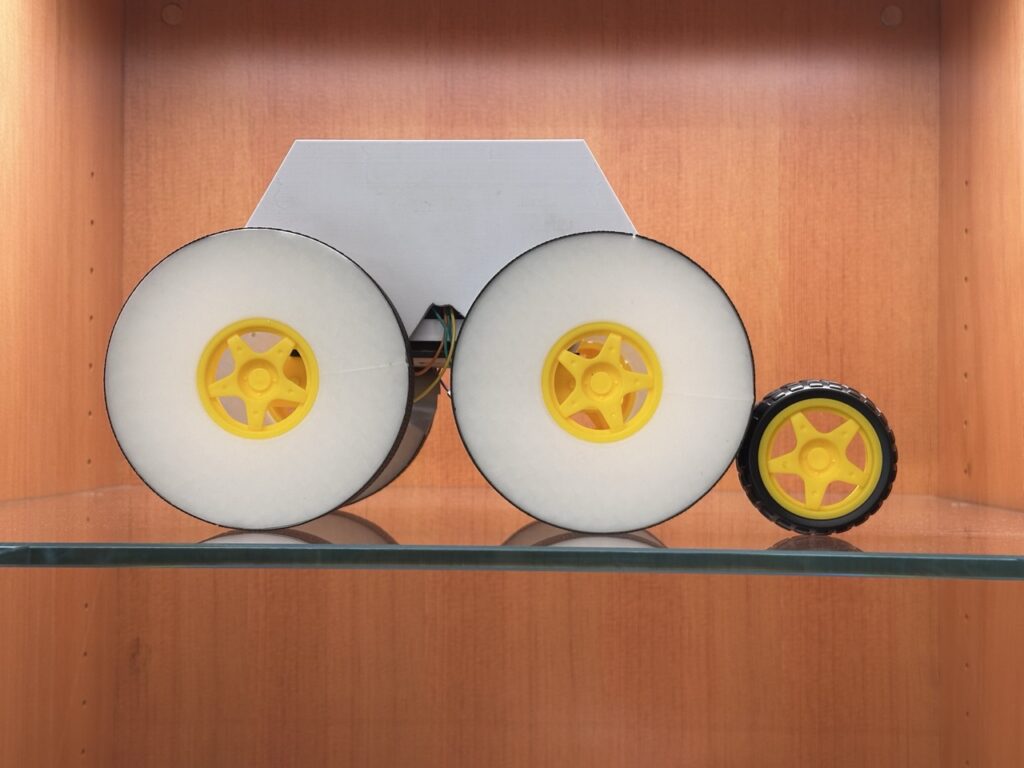
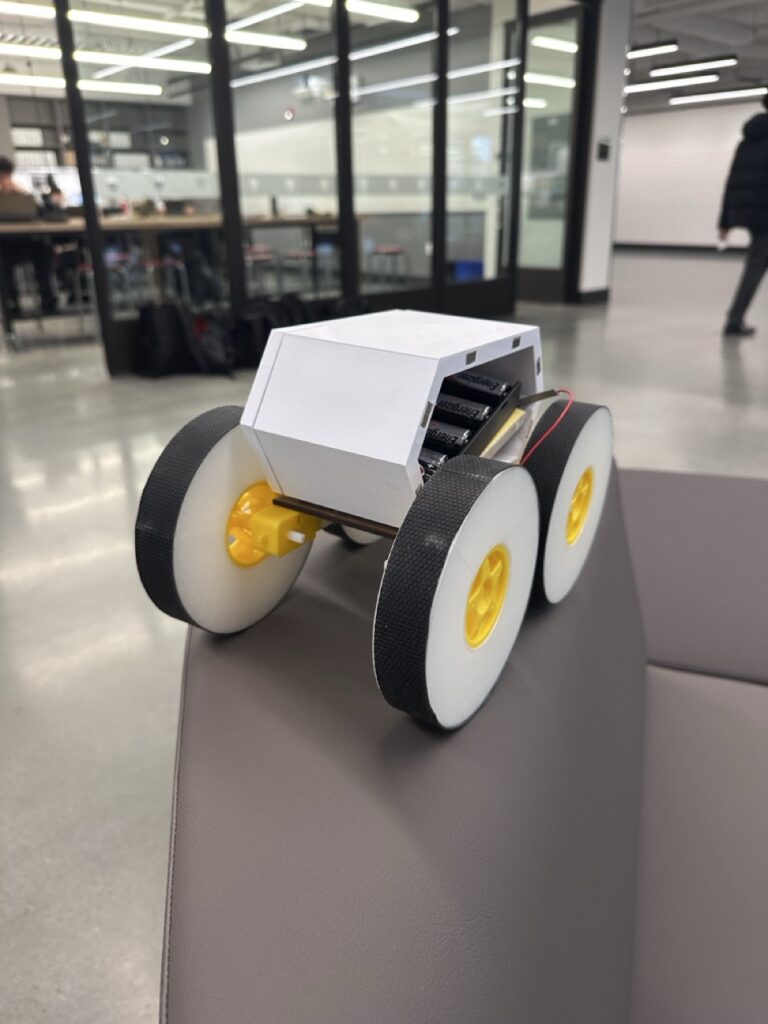
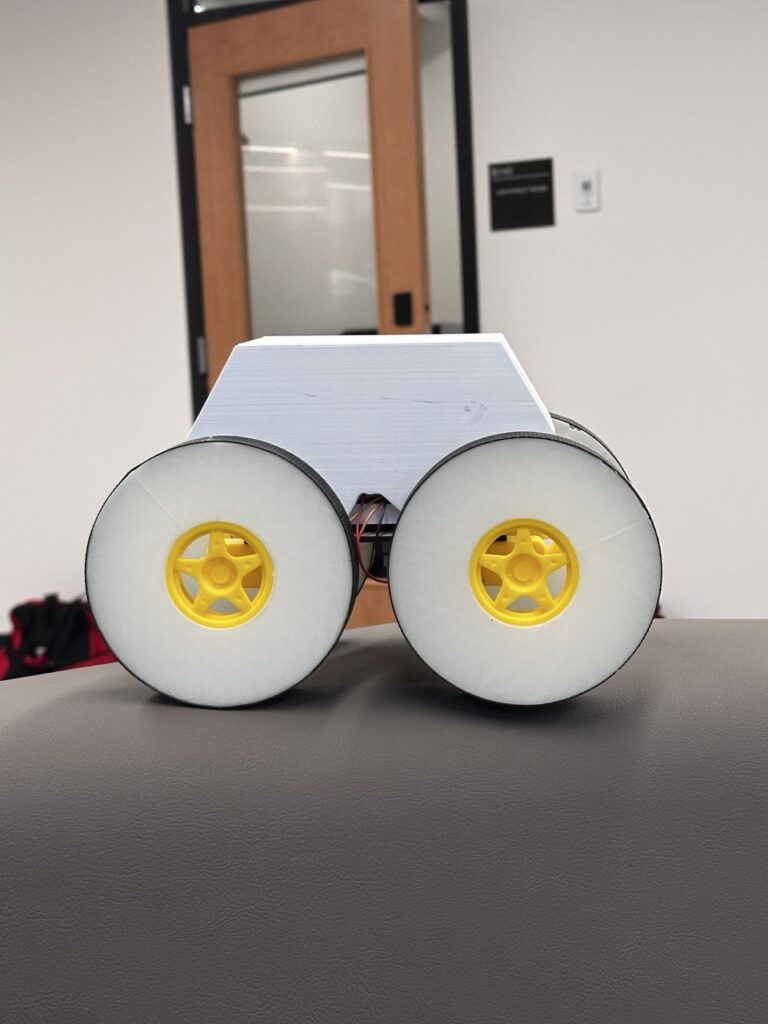
Our actual built prototype had similarities and differences to this initial plan. We ended up 3D printing custom wheels out of TPU (squishy filament) that were really big in hopes that they would act as suspension since the modeled suspension system here is too complicated. However, the body design basically didn’t change at all, and our vehicle’s doors were definitely one of, if not the coolest, parts of the vehicle in my opinion. It uses strong magnets to snap into place, and it’s really satisfying to use.
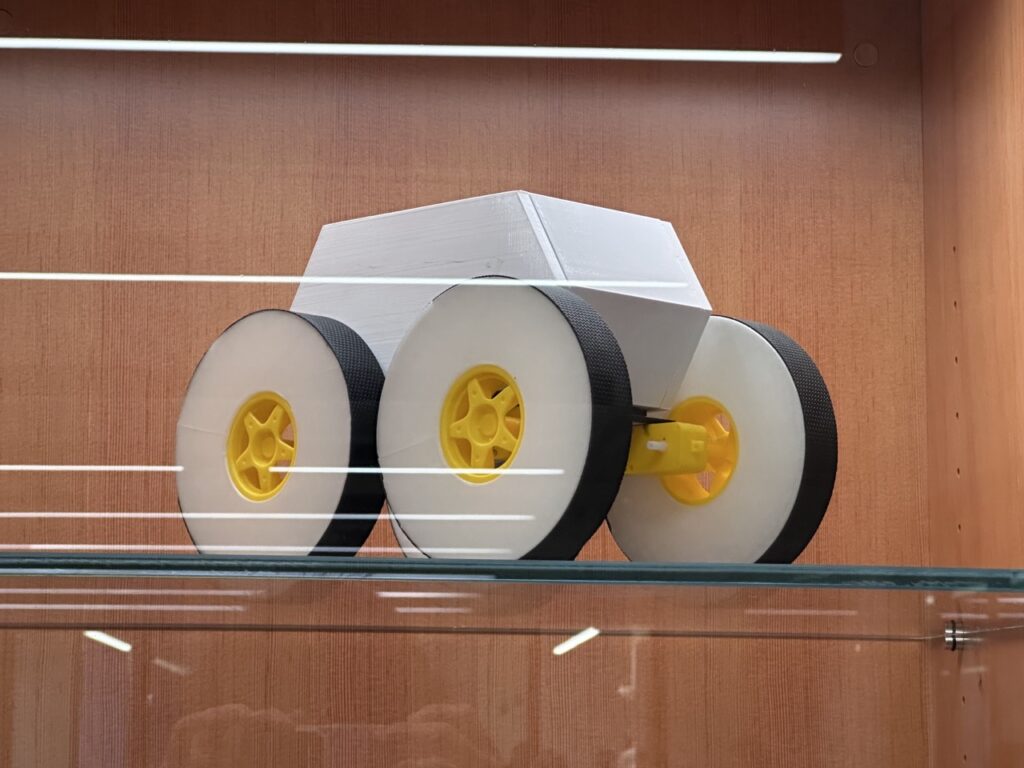
Here are some photos of our custom “large wheels” and the default “small wheels”:
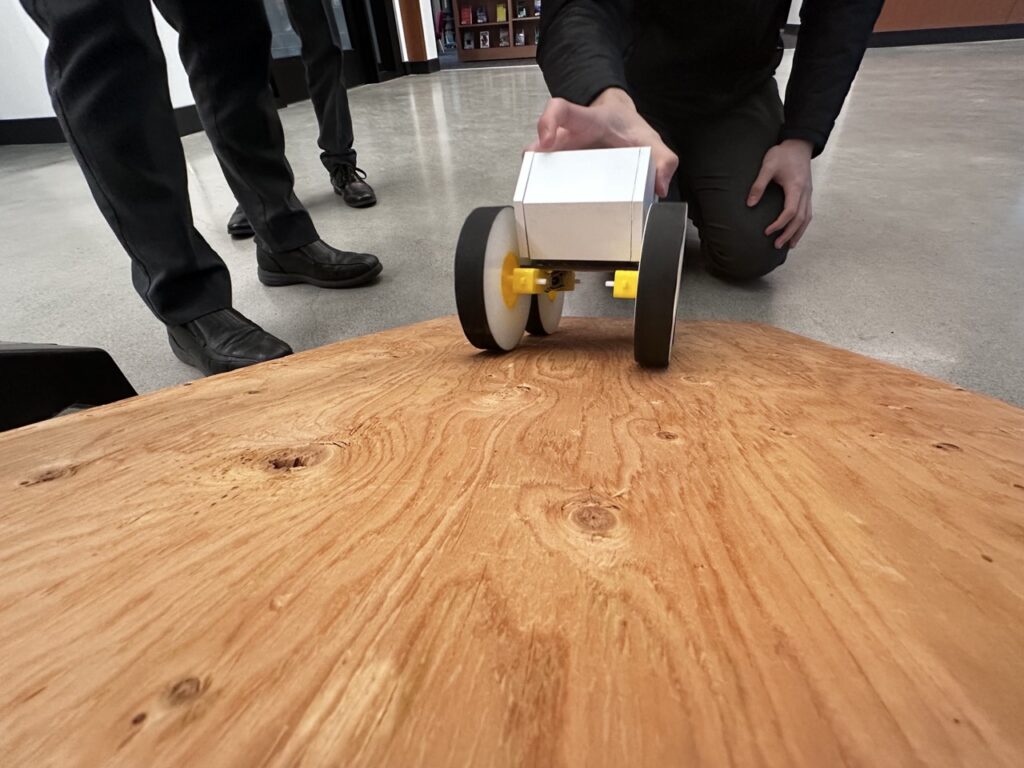
Here are some photos of our finished prototype:
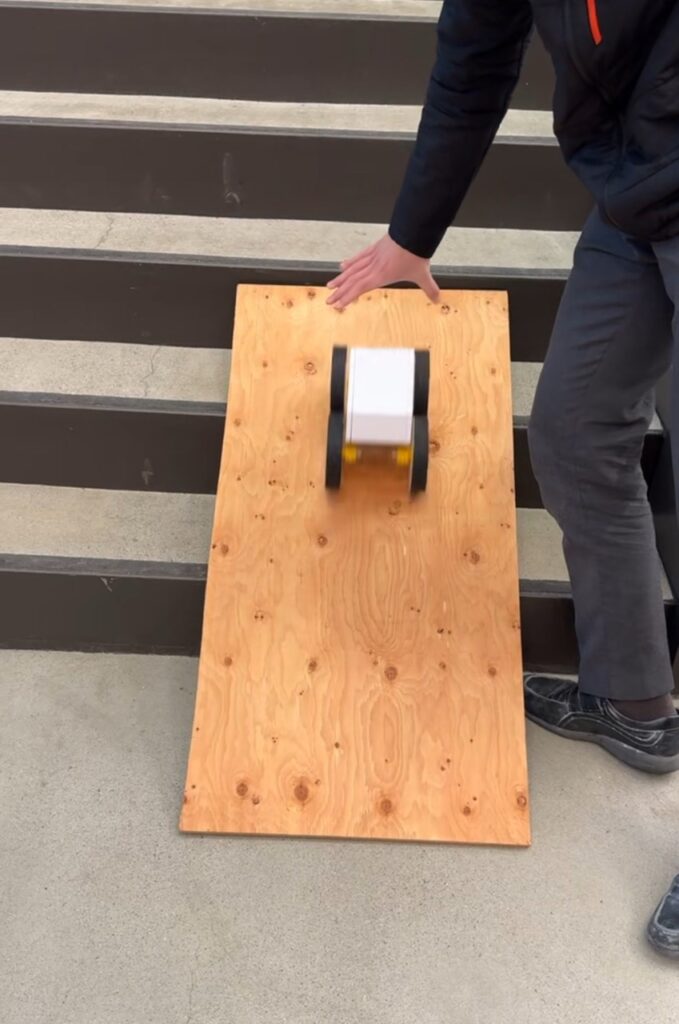
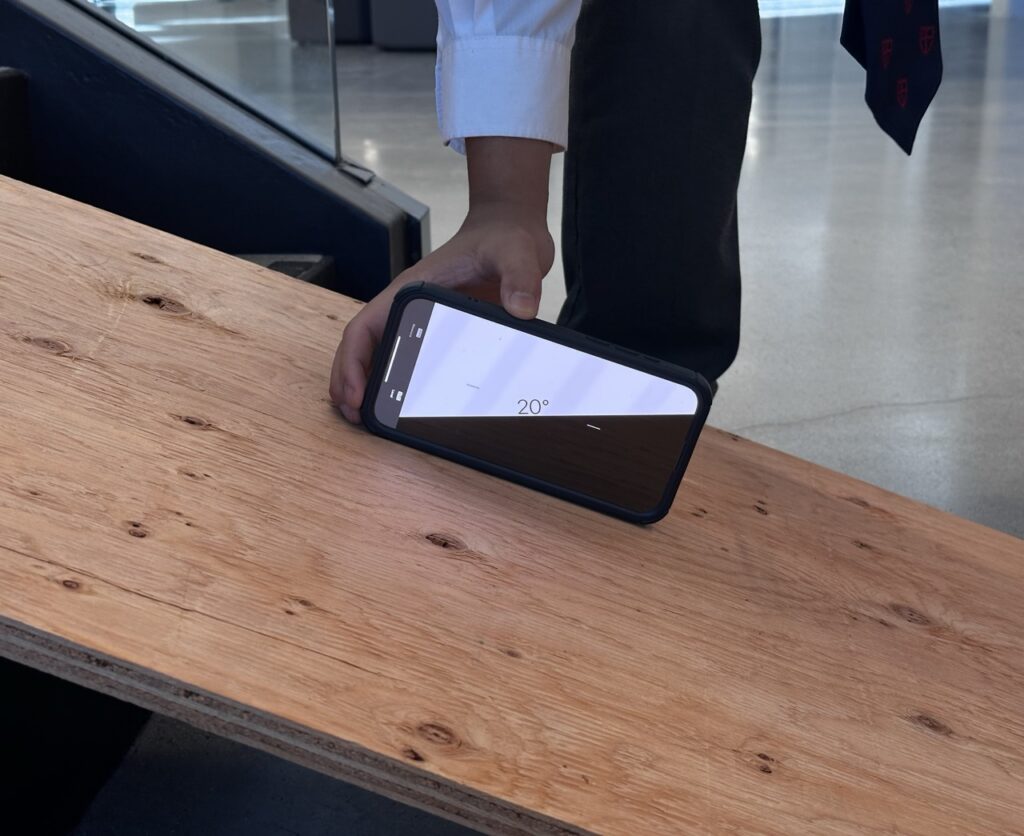
We tested the performance of the vehicle on an incline, and we used a board leaned against different steps of stairs and measured the angle that way to find the maximum angle the vehicle could climb. For this test, we increased the angles by increments of 5 degrees, starting at 10 degrees. We repeated this process for each one of the two wheels: standard DC motor wheels and the squishy ones we made. We rounded recorded data to the nearest half a second to make calculations later on easier. Our test performed basically as planned. Going in, we didn’t have an expectation as to which wheel would perform better, but the other parts of the test with expectations performed well.
Here are some photos of our testing setup:
–
Test Data
Here is all the raw data we collected from our test:
| Incline of ramp | Big wheel time (secs) | Small wheel time (secs) |
| 10° | 1.5 | 1.5 |
| 15° | 1.5 | 1.5 |
| 20° | 2.0 | 1.5 |
| 25° | 2.5 | 2.0 |
| 30° | 3.0 | 2.0 |
| 35° | Failed | 3.0 |
| 40° | Failed | Failed |
–
Data Analysis
This is how we created our energy output equation, which calculates how much energy each wheel outputs while climbing the ramp at different inclines:
Eout=mgh=m(g)(dsinθ)
- “m” is the the mass of the wheel in kilograms.
- Big wheels are 1.0 kg
- Small wheels are 0.8 kg
- “g” is the acceleration due to gravity on Earth, in meters/second
- 9.81 m/s here on earth
- “d” is the board/ramps length, in meters
- 1.5 m for us
- sinθ is calculated depending on the ramp’s incline
So, the data we gathered results in this equation: Eout=m(g)(1.5sinθ)
Plugging in the numbers from out test into this equation gives us this information:
| Incline (θ) | Vertical Height h (m) | Eout (Big Wheels, 1kg) (J) | Eout (Small Wheels, 0.8kg) (J) |
| 10° | 0.26 | 1.0×9.81×0.26 =2.55 | 0.8×9.81×0.26 =2.04 |
| 15° | 0.39 | 3.83 | 3.06 |
| 20° | 0.51 | 5 | 4 |
| 25° | 0.63 | 6.18 | 4.94 |
| 30° | 0.75 | 7.36 | 5.89 |
| 35° | 0.86 | (Failed) | 6.76 |
| 40° | 0.97 | (Failed) | (Failed) |
–
This is how we created our energy input equation, which calculates how much energy was inputed into the vehicle for it to climb the ramp:
Ein=P×t=V×I×t
Voltage of our batteries was 12V and the current was 0.8A, which means power (P) was 9.6W.
So, this information gives us the equation: Ein=9.6W×t
Using out test numbers with this equation gives us this new data:
| Incline (θ) | Ein (Big Wheels) (J) | Ein (Small Wheels) (J) |
| 10° | 9.6×1.5 =14.4 | 9.6×1.5 =14.4 |
| 15° | 14.4 | 14.4 |
| 20° | 19.2 | 14.4 |
| 25° | 24 | 19.2 |
| 30° | 28.8 | 19.2 |
| 35° | N/A | 28.8 |
| 40° | N/A | N/A |
–
The last step of our analysis was calculating how efficient our vehicle was depending on which wheel it had. We did so by using the efficiency formula:
Efficiency (η)=(Eout/Ein)×100%
By plugging in our input and output amounts from previous analyses, we can this information on efficiency:
| Incline (θ) | Efficiency (Big Wheels) (%) | Efficiency (Small Wheels) (%) |
| 10° | (2.55/14.4)×100 =17.7% | (2.04/14.4)×100 =14.2% |
| 15° | 26.60% | 21.20% |
| 20° | 26.00% | 27.80% |
| 25° | 25.80% | 25.70% |
| 30° | 25.60% | 30.70% |
| 35° | Failed | 23.50% |
| 40° | Failed | Failed |
Here is this data put onto a graph:

–
The data above shows that the original DC motors (aka the smaller wheels) tended to perform better than our custom big wheels most of the time. This was most noticeable when the ramp became steeper. Our hypothesis around this gap in performance is that the vehicle performs better with small wheels because it has a lower center of mass. With bigger wheels, the vehicle was much higher above the ground, so the center of mass was high up, which required more grip on the wheels and more power for the vehicle to climb the same amount. The smaller wheels allowed the vehicle to stay closer to the ground, making it less likely to fall backward and easier to climb and create friction between the wheels and the ramp, which made it perform better.
TL;DR: We think the smaller wheels performed better than the big wheels because they allowed the vehicle to have a lower center of mass, which created more friction and helped it climb better and faster with the same amount of energy input as the large motors.
–
Conclusion
All in all, our wheels didn’t perform as well as the original wheels in this particular incline test in terms of raw performance and efficiency. However, through this first prototype, we now know the specific areas that our vehicle could improve in to make it much better. In the future, I want to add grippier tires to increase friction between the tires and the ramp. I could do this by researching better coatings to cover the printed tires with to increase traction or also research what tread patterns to potentially add to make it more frictional. I also want to change the design so that the center of mass is much lower to the ramp. This could mean attaching the motors at the top of the body of the vehicle so that the heavy electronics are close to the ground.
Additionally, although this is unrelated to the specific test we did, we want to experiment more with printing the wheels since the ones on this prototype didn’t print as squishy and absorbing as we were hoping, and a squishier wheel could also help in increasing grip and lowering the center of mass.
–
If we were to use this design concept on Ceres, it would theoretically come with many benefits. Even if it’s less efficient than normal wheels, it compensates for that and earns some advantages because of its adapted design for the characteristics of Ceres’ surface. Ceres has a rocky and uneven surface, so the squishy wheels act as suspension that would make driving over sharp objects easy and cause less damage to the wheels than traditional vehicle wheels on extraterrestrial objects. Its higher center of mass would also be beneficial because this means the big rocks would be less likely to be high enough to scratch or damage the body of the vehicle, which is where the actual humans are housed, and significant damage could potentially risk their safety.
So, although in this initial test we did on our prototype, our concept seems less efficient and reliable at climbing than traditional vehicle designs, the unique challenges that Ceres’ surface brings make our specialized design more understandable and useful.
–
AI Transparency Statement
AI was used to research how efficiency could be calculated and to help come up with formulas. Apple’s AI tools were used for spellchecking purposes.
Leave a Reply to tdai27 Cancel reply