Introduction
When I started this project, my goal was simple: make a robot that moves. But, I wanted it to move for a reason.
I’ve always liked when information feels tactile. Numbers on a screen are easy to ignore, but a servo arm sweeping up when a stock jumps 3% instantly catches your attention. That idea ended up becoming the foundation for this build.
The project’s objective was to demonstrate all the robotics basics we were asked to show: circuit building, Arduino programming, and physical motion, but I wanted to frame it around something that actually felt useful to me. So I wanted to build something I was actually impressed with. That ended up being a finance-themed Arduino robot: a stock ticker dashboard that displays simulated market data on an LCD, flashes LEDs to show gains or losses, plays a short buzzer tone when the market spikes, and most importantly, moves a servo needle to visualize percentage change.
It started in Tinkercad as a virtual prototype, then evolved into a physical circuit. Along the way, I used AI to accelerate design and debugging, acting almost like a lab assistant that could instantly sketch code or explain pin mapping when I got stuck.
The Intended Device
The final device simulates real-time market data and converts it into physical motion.
Inputs
- Simulated stock data (randomized within realistic daily change ranges).
- Manual button controls to cycle between symbols.
Outputs
- 16×2 LCD showing ticker symbol, current price, and percentage change.
- Green LED when gain > 0.05%, red LED when loss < −0.05%.
- Active buzzer for large absolute changes (> 2%).
- Servo gauge (SG90) that maps −5% → 0°, 0% → 90°, +5% → 180°, so it physically “swings” with the market.
Purpose
It doesn’t just print numbers, it acts out what the market is actually doing. The servo transforms data into movement, which is the robotics component that meets the assignment’s “device must move something” criterion.
Virtual Prototype and Circuit
Circuit Schematic – How It Works
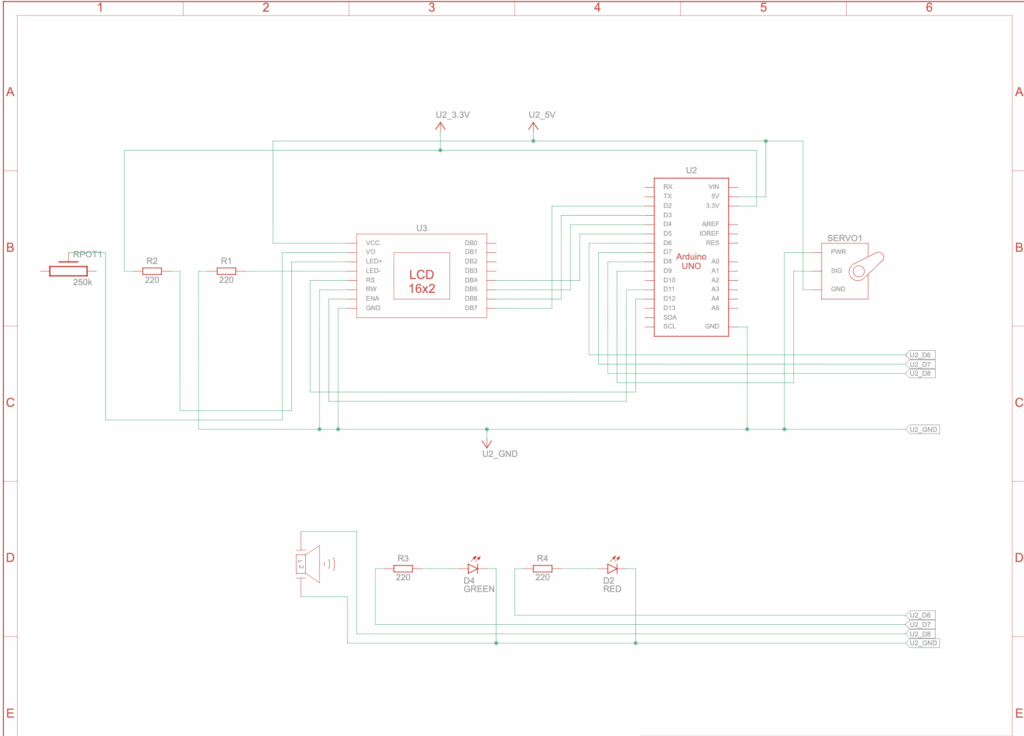
In Tinkercad, I began by laying out the basic connections:
| Component | Arduino Pin | Notes |
|---|---|---|
| LCD 16×2 | RS = 12, E = 11, D4 = 5, D5 = 4, D6 = 3, D7 = 2 | Backlight through 220 Ω resistor |
| Green LED | D6 (with 220 Ω) | Gain indicator |
| Red LED | D7 (with 220 Ω) | Loss indicator |
| Buzzer | D8 | Audio alert |
| Servo (SG90) | D9 | Signal; powered at 5 V |
| Buttons | A1 = next, A2 = prev | INPUT_PULLUP mode |
All grounds are shared. The backlight has its own resistor to avoid the “7000 A” simulation bug that Tinkercad throws (that I also got earlier) if you wire it directly to 5 V.
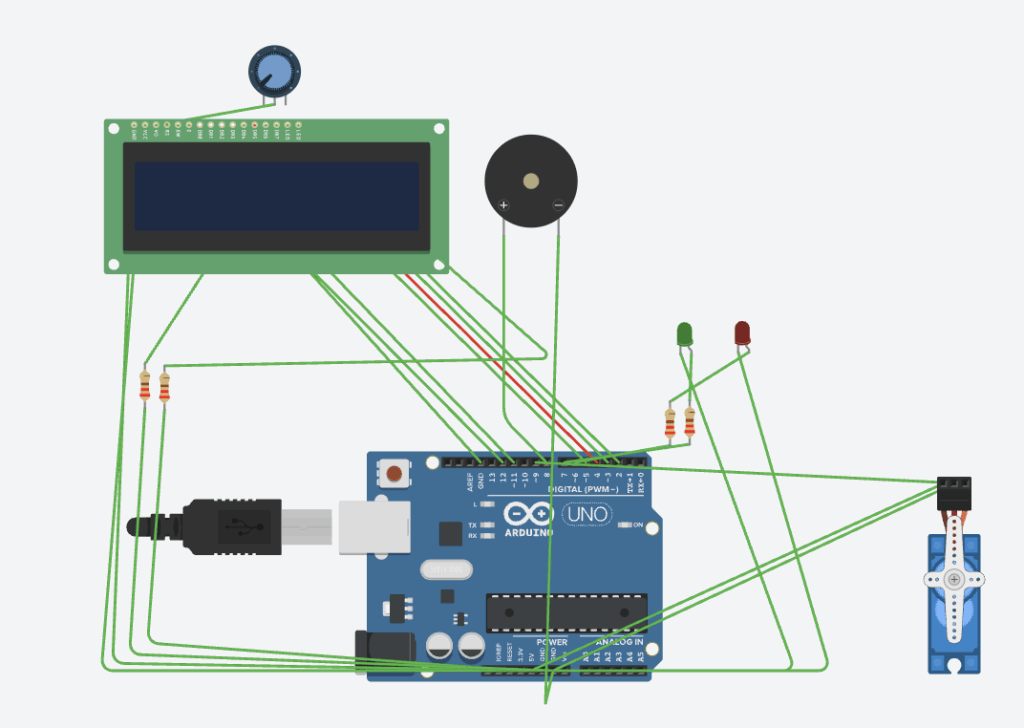
Once wired, I ran the circuit on Tinkercad’s simulator; no API calls yet, just random price deltas to test out the functionality. The servo arm moved and LEDs blinked. Well, this had to have been at least a quarter of the way to a Bloomberg terminal.
Bill of Materials (BOM)
| Part | Qty | Description |
|---|---|---|
| Arduino Uno R3 | 1 | Microcontroller |
| 16×2 LCD display | 1 | Output screen |
| SG90 micro-servo | 1 | Mechanical actuator |
| Green + Red LEDs | 2 | Gain/Loss indicators |
| 220 Ω resistors | 3 | Current limiting |
| Active buzzer | 1 | Alert tone |
| Breadboard + wires | 1 set | Circuit base |
| (Optional) Buttons | 2 | Navigate tickers |
Code – How It Works
I wrote the code modularly with functions like simulateMarketJitter(), redraw(), and updateGauge() so each handled one task.
The simulation runs every three seconds, picking new random ±% changes to mimic stock volatility. The display, LEDs, buzzer, and servo update together.
Example excerpt:
void updateGauge(float changePct) {
  float capped = constrain(changePct, -5.0, 5.0);
  int target = (int)round(mapFloat(capped, -5.0, 5.0, 0.0, 180.0));
  int step = (target > lastAngle) ? 2 : -2;
  for (int a = lastAngle; a != target; a += step) {
    gauge.write(a);
    delay(12);
  }
  lastAngle = target;
}
Code explanation:
constrain()prevents unrealistic motion beyond ±5%.mapFloat()converts percentage change into servo angle.- Small step delay smooths the motion so it feels analog instead of jerky.
Prototype Demo
In simulation, every few seconds the LCD changes:
NVDA 207.3
+1.9%
This causes the servo to swing upward, leading to green LED lights and a short buzzer pulse.
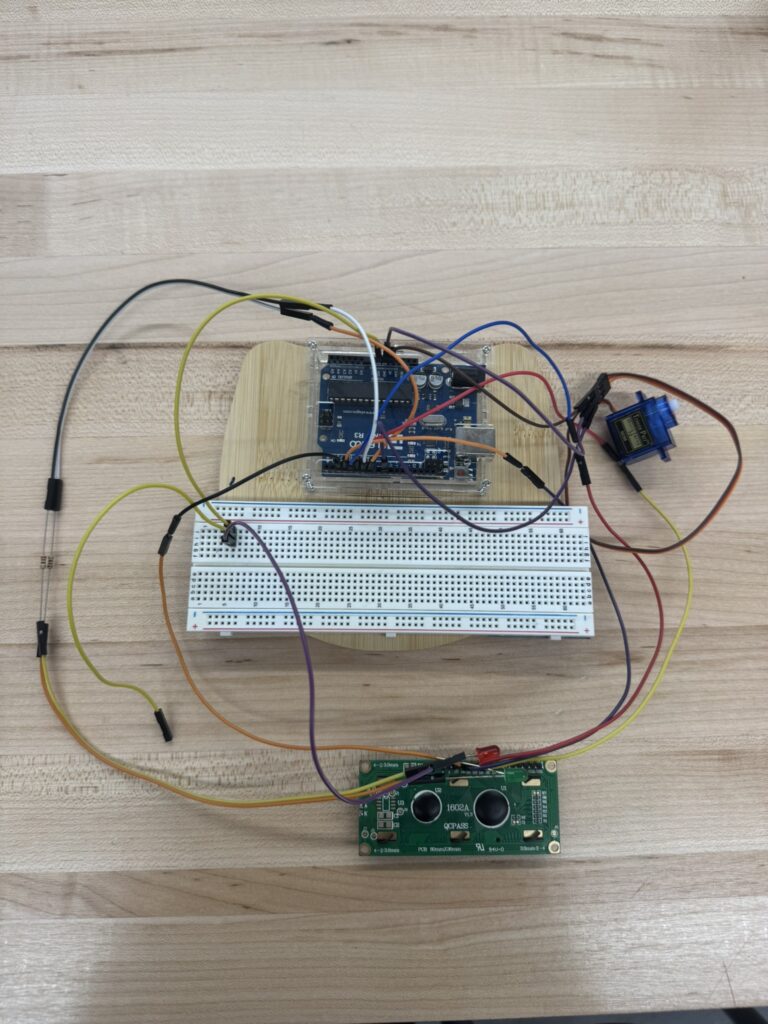
Physical Prototype
After the simulation worked, I rebuilt it on a real breadboard.
I immediately learned that power delivery mattered more in real life. The servo briefly reset the Arduino when it drew too much current on sudden jumps. The fix was to move the servo to an external 5 V rail while keeping a common ground.
The rest transferred cleanly from Tinkercad: same pinout, same code. The only tuning was reducing the tone volume by adding a resistor in series with the buzzer so it wouldn’t be distracting.
What I learned:
- Simulations don’t model current draw or electrical noise.
- Real wiring forces you to think about wire length, shared grounds, and stable voltage.
- Even a simple robot introduces system-level thinking that I have yet to utilise prior to this point. This resulted in mechanical, electrical, and software layers to all be interacting.
Arduino Programming
- The ticker cycles through an array using modulo indexing.
- The servo angle directly depends on computed
changePct. - LEDs and buzzer thresholds act as visual and auditory “sensors.”
- Debounce code ensures buttons aren’t triggered multiple times per press.
The main loop is small but expressive, aiming to combine time-based updates with manual control:
if (millis() - lastAutoUpdate > 3000) {
  simulateMarketJitter();
  redraw();
  idx = (idx + 1) % n;
}
That single snippet captures computational thinking: time control, state change, and loop iteration.
Testing and Debugging
My debugging process was data-driven:
- LCD blank screen: fixed by confirming
lcd.begin(16,2)and adjusting contrast with potentiometer. - Backlight overcurrent warning: solved by 220 Ω resistor.
- Servo overshoot: introduced
abs(targetAngle - lastAngle) < 2deadband. - Buzzer too loud: series resistor (~100 Ω).
Each problem forced me to identify cause, test, iterate. This is the same loop real engineers (and I try to as well) use. My iterations went as followed:
- v1: LCD only, static prices.
- v2: Added servo gauge → movement achieved.
- v3: Added LEDs, buzzer, and smoother motion.
- v4 (next): Upgrade to ESP32 for live data, add a small acrylic enclosure, maybe an OLED or LED matrix.
Final Demo
When you run the simulation, the device transforms into a living market ticker. Here is the step-by-step loop that occurs every 3 seconds:
- The Arduino generates a randomized volatility event (e.g., “NVDA jumps +4.2%”).
- The code constrains this percentage and maps it to a servo angle. We treat 0% change as 90° (center), so a rally pulls the needle right (180°) and a crash pulls it left (0°).
- The Physical Output:
- Visually, the LCD updates the price, and the Green LED lights up to signal profit.
- Kinetically, the servo arm sweeps to the new position. I added a slight delay in the loop so the needle “swings” with momentum rather than snapping instantly, mimicking the tension of a live market move.
- Audibly, if the change is drastic (greater than 2%), the buzzer fires a short alert tone.
Instead of reading a static number, you feel the market movement and it takes your attention during huge moves. No guarantees this protects your portfolio, though.
In terms of the physical build, I wasn’t able to finish it in the time provided. However, I am currently finding the parts to turn this build into reality.
Reflections on Use of AI
Process
- I described what I wanted (“a finance-themed Arduino robot that moves”).
- The AI generated candidate designs, part lists, and starter code.
- I refined each step: adding simulation-friendly logic, replacing web calls with mock data, and ensuring resistor safety.
Why It Worked
AI condensed what would have been hours of forum-searching into minutes. It didn’t remove the need for understanding; it accelerated it.
What Didn’t Work
Tinkercad doesn’t allow Wi-Fi libraries, so I had to fake the data.
That limitation forced me to separate logic (display + motion) from input (price feed), which ironically improved modular design.
My lesson from this was using AI responsibly isn’t about copying answers, but more about asking better questions.
Ethics, Sustainability, and Privacy
- When I add live APIs later, the design keeps API keys local and avoids cloud dependencies.
- The project uses common, re-usable parts. Nothing was glued or soldered permanently.
- Both LEDs and textual symbols (+/−) make the display readable to color-blind users.
- The device visualizes information without promoting real trading; it’s purely educational.
Conclusion
The final product is simple but complete: an Arduino robot that combines hardware, software, and creativity into something that actually moves with purpose.
It visualizes stock data physically, making otherwise abstract numbers intuitive and also giving a physical alternative to looking at stock prices on a screen.
Through this, I met every requirement of the robotics project, circuit building, coding, motion, and documentation. On top of this, I learned more about control systems, debugging, and how AI can be a genuine accelerant for hands-on learning.
Next step:
- port it to an ESP32
- pull real-time prices from an API
- 3D-print an enclosure so it looks like a real desktop gauge.
Still though, it’s already a working robot that bridges finance, code, and motion together.
Appendices
Tinkercad Link: https://www.tinkercad.com/things/lRPvYnqmoON-stock-ticker?sharecode=hU9nZSsUYWFov2j3DLgzLQUjvtdAecAxG6dyqkGC4ig
AI Transcript: https://docs.google.com/document/d/11tibHoaTOvoEQtsQXAqJEDCrnXzpM4t7cjifpVJ2WWY/edit?usp=sharing
Leave a Reply to mcrompton Cancel reply