Introduction
This assignment is to design a vehicle for a planet – our potential future home. This is the second half of the Planetary Exploration Project (PEP).
In the first half, our group conducted research on the planet Proxima Centauri B and learned that the planet potentially has similar conditions as the Earth but with a lot of unique and uncertain conditions. We made several assumptions based on our collected data to inform our vehicle design, including a rough, rocky surface, thinner atmosphere, stronger gravity, and hush radiation.
The second half of this project is to build a prototype of the vehicle, test how the prototype works to address these assumed conditions and identify the limitations and future work.
We spent two months and went through many stages to land on some preliminary outcomes. This report documents the stages and associated work we have done up to this point.
STAGE 1: Identify the Problem (1-2 Weeks)
Since we are building and testing our vehicle our school campus, we cannot mimic the conditions of a thinner atmosphere, greater gravity, and severer radiation, like on Proxima Centauri B, we focus our problem on:
Building a strong and efficient vehicle to consistently and safely travel a 10 km round trip on uneven, rocky terrain with inclines.
STAGE 2: Design Prototype (2-3 Weeks)
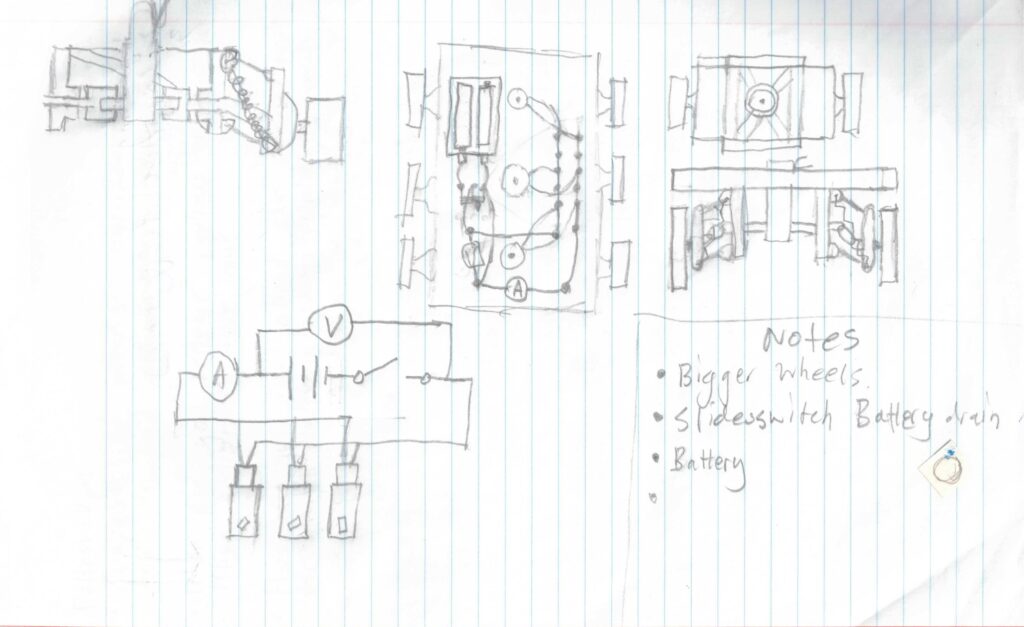
Design Sketches
It started with sketches to think through design ideas and plan the steps.
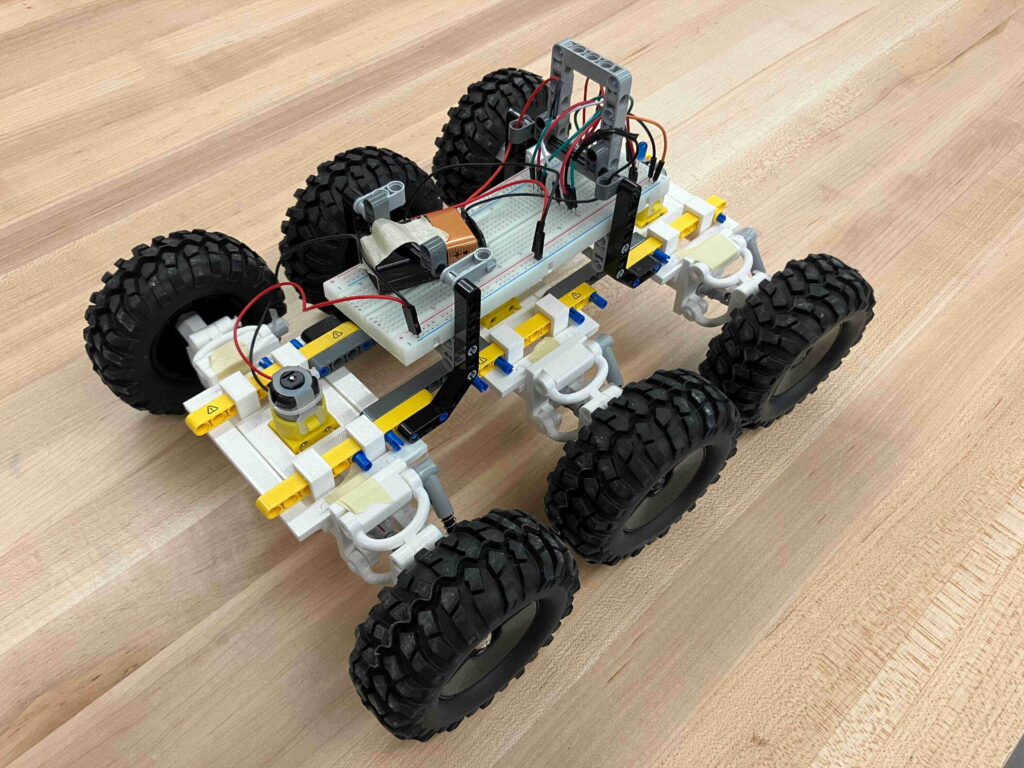
Design Overview
The prototype is a six-wheeled vehicle driven by three motors. It is approximately 320 mm long and 230 mm wide. It includes three modules that are connected together firmly to form the base plane of the vehicle. The electrics and batteries are placed centrally on the top of the base plane. The vehicle casing is not considered the most relevant factor for this defined problem and is therefore not included in this project. It should be addressed in future design development, particularly when considering issues related to radiation and thermal management.
Key Design Features
- Modular Design
We chose a three modules design because this would save three motors and reduce the overall vehicle weight. Each module includes a dual-shaft motor, a pair of independent suspension systems, double-universal joints, and wheels.
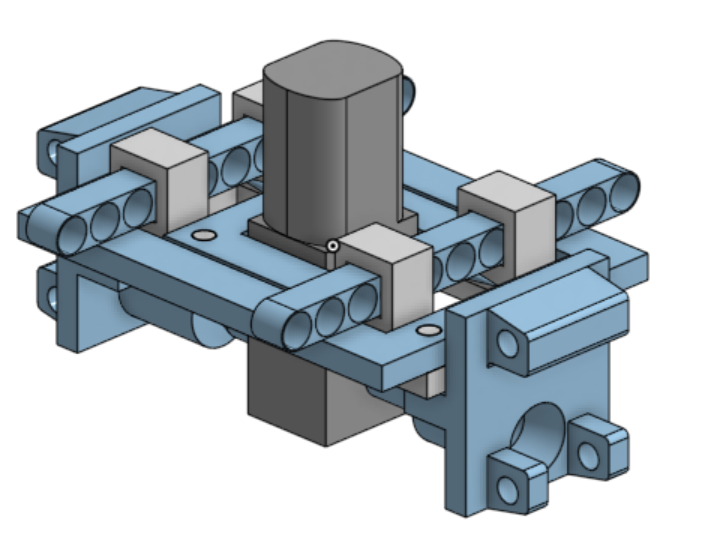
- Suspension System
A core feature is the suspension system, which allows for each wheel to adapt to different elevations while keeping the base stable. It is based on a double wishbone design. It consists of a spring, a frame, two couplers, a wheel holder, and a space for a double universal joint. The frame, couplers, and wheel holder form a four-bar linkage that ensures the wheel stays upright while still being able to move up and down. The spring adjusts the height of the wheels at different elevations.
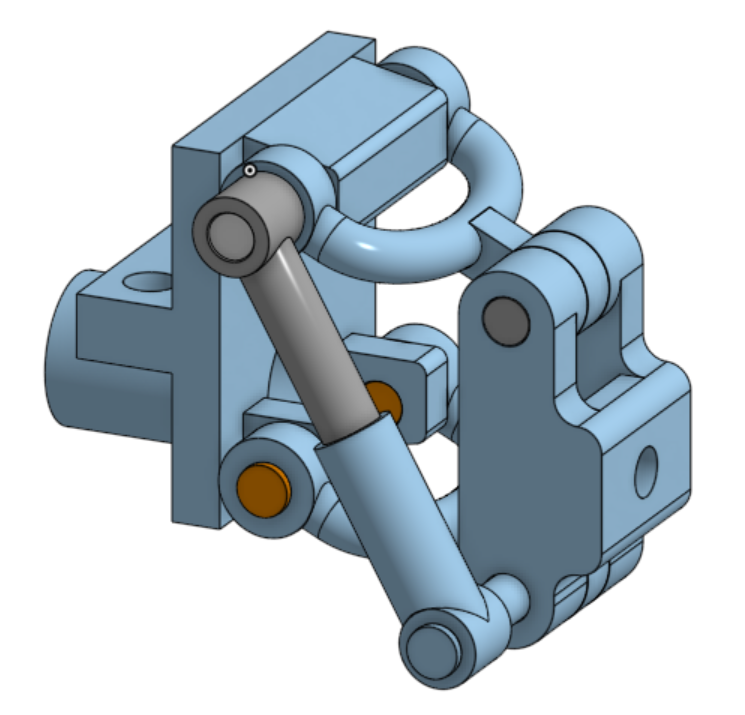
- Universal Joint
The universal joint is an essential component that connects the dual-shaft motor and wheels to ensure that they can still spin at any height.
Design Electronics
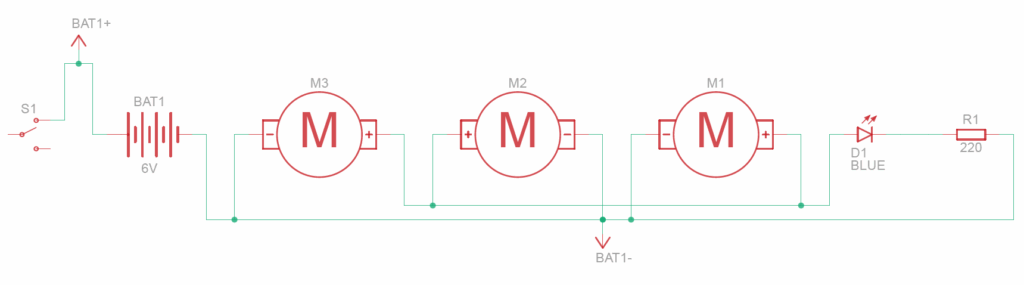
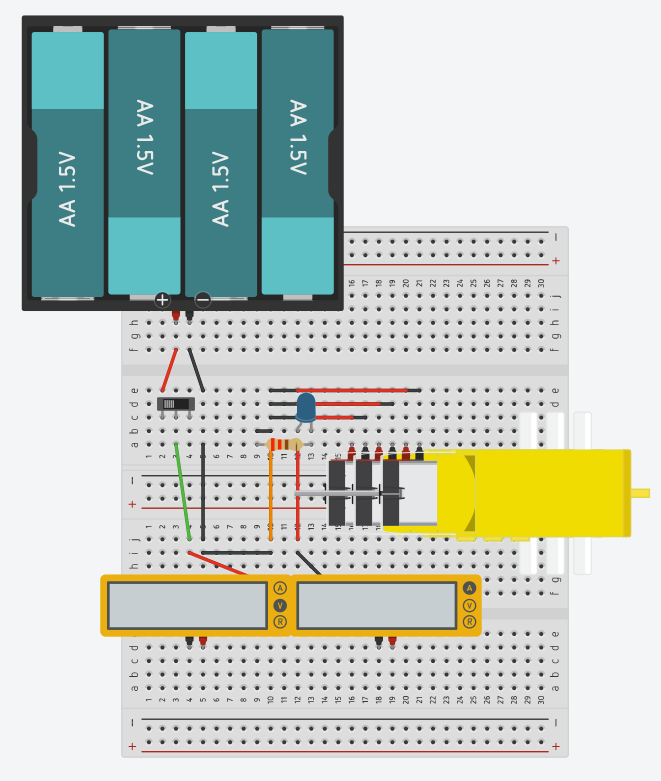
The electronics are placed down the center of the vehicle to organize the wires and keep the vehicle balanced. The electronics consist of the motors, a battery, a breadboard, a slide switch, a LED, a resistor, and a lot of wires. The circuit connects the battery to the motors. The slide switch controls the on or off of the motor, and the LED signals when the motor is on.
The circuit was adjusted to fit better on the breadboard when making the physical prototype.
Additionally, in order to make measuring voltage and current easier during the testing, we specifically designed the circuit with this in mind.
The circuit originally had a direct connection from the positive end of the battery to the slideswitch. For the voltage, we added some wires in parrellel to the original wire. This allowed us to easily attach a voltmeter to these new wires, without disturbing the original wire. For the current, we split the original wire into two in-series wires. This allowed us to easily disconnect the wires and attach an ammeter in-between them to measure current.
Schematic
Circuit
Prepare Materials
Bill of Materials
| Material | Type | Amount |
| Lower Body – Motor Holder | 3D printed | 3 |
| Lower Body – Motor Adaptor | 3D printed | 6 |
| Lower Body – Wheel Adaptor | 3D printed | 6 |
| Lower Body – Plate | 3D printed | 3 |
| Upper Body – Plate | 3D printed | 6 |
| Suspension – Center Half | 3D printed | 6 |
| Suspension – Wishbone | 3D printed | 12 |
| Suspension – Axle Holder | 3D printed | 6 |
| Axle – 10mm, Round, Endcap | 3D printed | 12 |
| Axle – 20mm, Round, Endcap | 3D printed | 6 |
| Axle – 35mm, Round, Endcap | 3D printed | 6 |
| Axle – 43mm, Round, Endcap | 3D printed | 6 |
| Breadboard | Electronics | 1 |
| 9V Battery | Electronics | 1 |
| 9V Battery Head | Electronics | 1 |
| Blue LED | Electronics | 1 |
| Slideswitch | Electronics | 1 |
| Resistor (220Ω) | Electronics | 1 |
| Hobby Gearmotor | Electronics | 3 |
| Wires (Male to Male) | Electronics | 8 |
| Toothpick | Other | 6 |
| Wheels | Other | 6 |
| Technic – Universal Joints | LEGO | 12 |
| Technic – Springs / Shock Absorber | LEGO | 6 |
| Technic – Spacer / Bush | LEGO | 8 |
| Technic – Beams | LEGO | 22 |
| Technic – Axle | LEGO | 8 |
| Technic – Pin | LEGO | 24 |
STAGE 3: Build the Prototype (3 Weeks)
Final Prototype Assembly
Learn from Failures
- Printing Tolerance
When designing the parts in Onshape they could fit perfectly together, but when printing parts that needed to mesh together, I needed some tolerance. Getting the right tolerance took a bit of trial and error. I found that for circular connections, 5 mm diameter for the hole and 4.75 mm for the axle worked well.
- Printing Precision
Although CAD design can have really small dimensions and high precision, the physical products from 3D-printing did not perform as expected and were constrained by the resolution of my equipment. For example, the complicated universal joint mechanism could not be printed to a degree that it could handle the strengths of the motor. In the end, we used lego universal joints.
- Wheel Size
During assembly, the wheel size was not big enough. The first prototype’s wheels had a diameter of 60mm. They were small and the vehicle base sometimes hit the floor. The new wheels are 95 mm wide and are just big enough to run on uneven terrain with small clearance.
- Material Strength
When I assembled the car, a few 3D pieces were broken easily. I found the reason is that the layered 3D printing makes the piece relatively weak vertically between layers, so I re-oriented the 3D pieces to print some stress points horizontally and it fixed the problems.
STAGE 4: Test the Prototype (2 Weeks)
Purpose of Test
We tested the prototype to answer the following questions:
- How well does the suspension system work on uneven terrain?
- Does it perform as expected?
- What is the efficiency of the prototype?
- Does it help to estimate the needed energy for a 10km round trip on the planet?
Therefore, we conducted three separate tests:
- The suspension test
- The distance efficiency test
- The energy efficiency test
Suspension Test
The suspension test is qualitative and is meant to gauge how well the suspension engages with the uneven, rocky terrain while stabilizing the ride. With the suspension system, the wheels are expected to land on different elevations independently.
Since the size of wheels is critical to the outcome of the test, we conducted comparison tests with two sizes of wheels 60mm and 95 mm.
While they were tested on different slopes and surface conditions, they both demonstrated good suspension performance with the ability to consistently engage with the uneven surface and remain stable.
Suspension Test with 60mm wheels:
Suspension Test with 95mm wheels:
Distance Efficiency Test
- Formulas
Distance efficiency is a measure of how much energy is needed to travel a certain distance, calculated by the formula:
is distance efficiency.
is the distance.
is the consumed energy, which is the product of battery voltage, current, and the time spent (
).
- Test Design
We design two types of terrain, flat and incline, to test the baseline of distance efficiency with the flat scenario and a challenging situation with the incline scenario.
- Data Collection and Calculation
| Distance | Voltage | Current |
| 0.65 m | 6.15 V | 5.40 A |
Flat Test (Base Scenario)
| Time – Test 1 | Time – Test 2 | Time – Test 3 |
| 1.075 s | 1.059 s | 1.075 s |
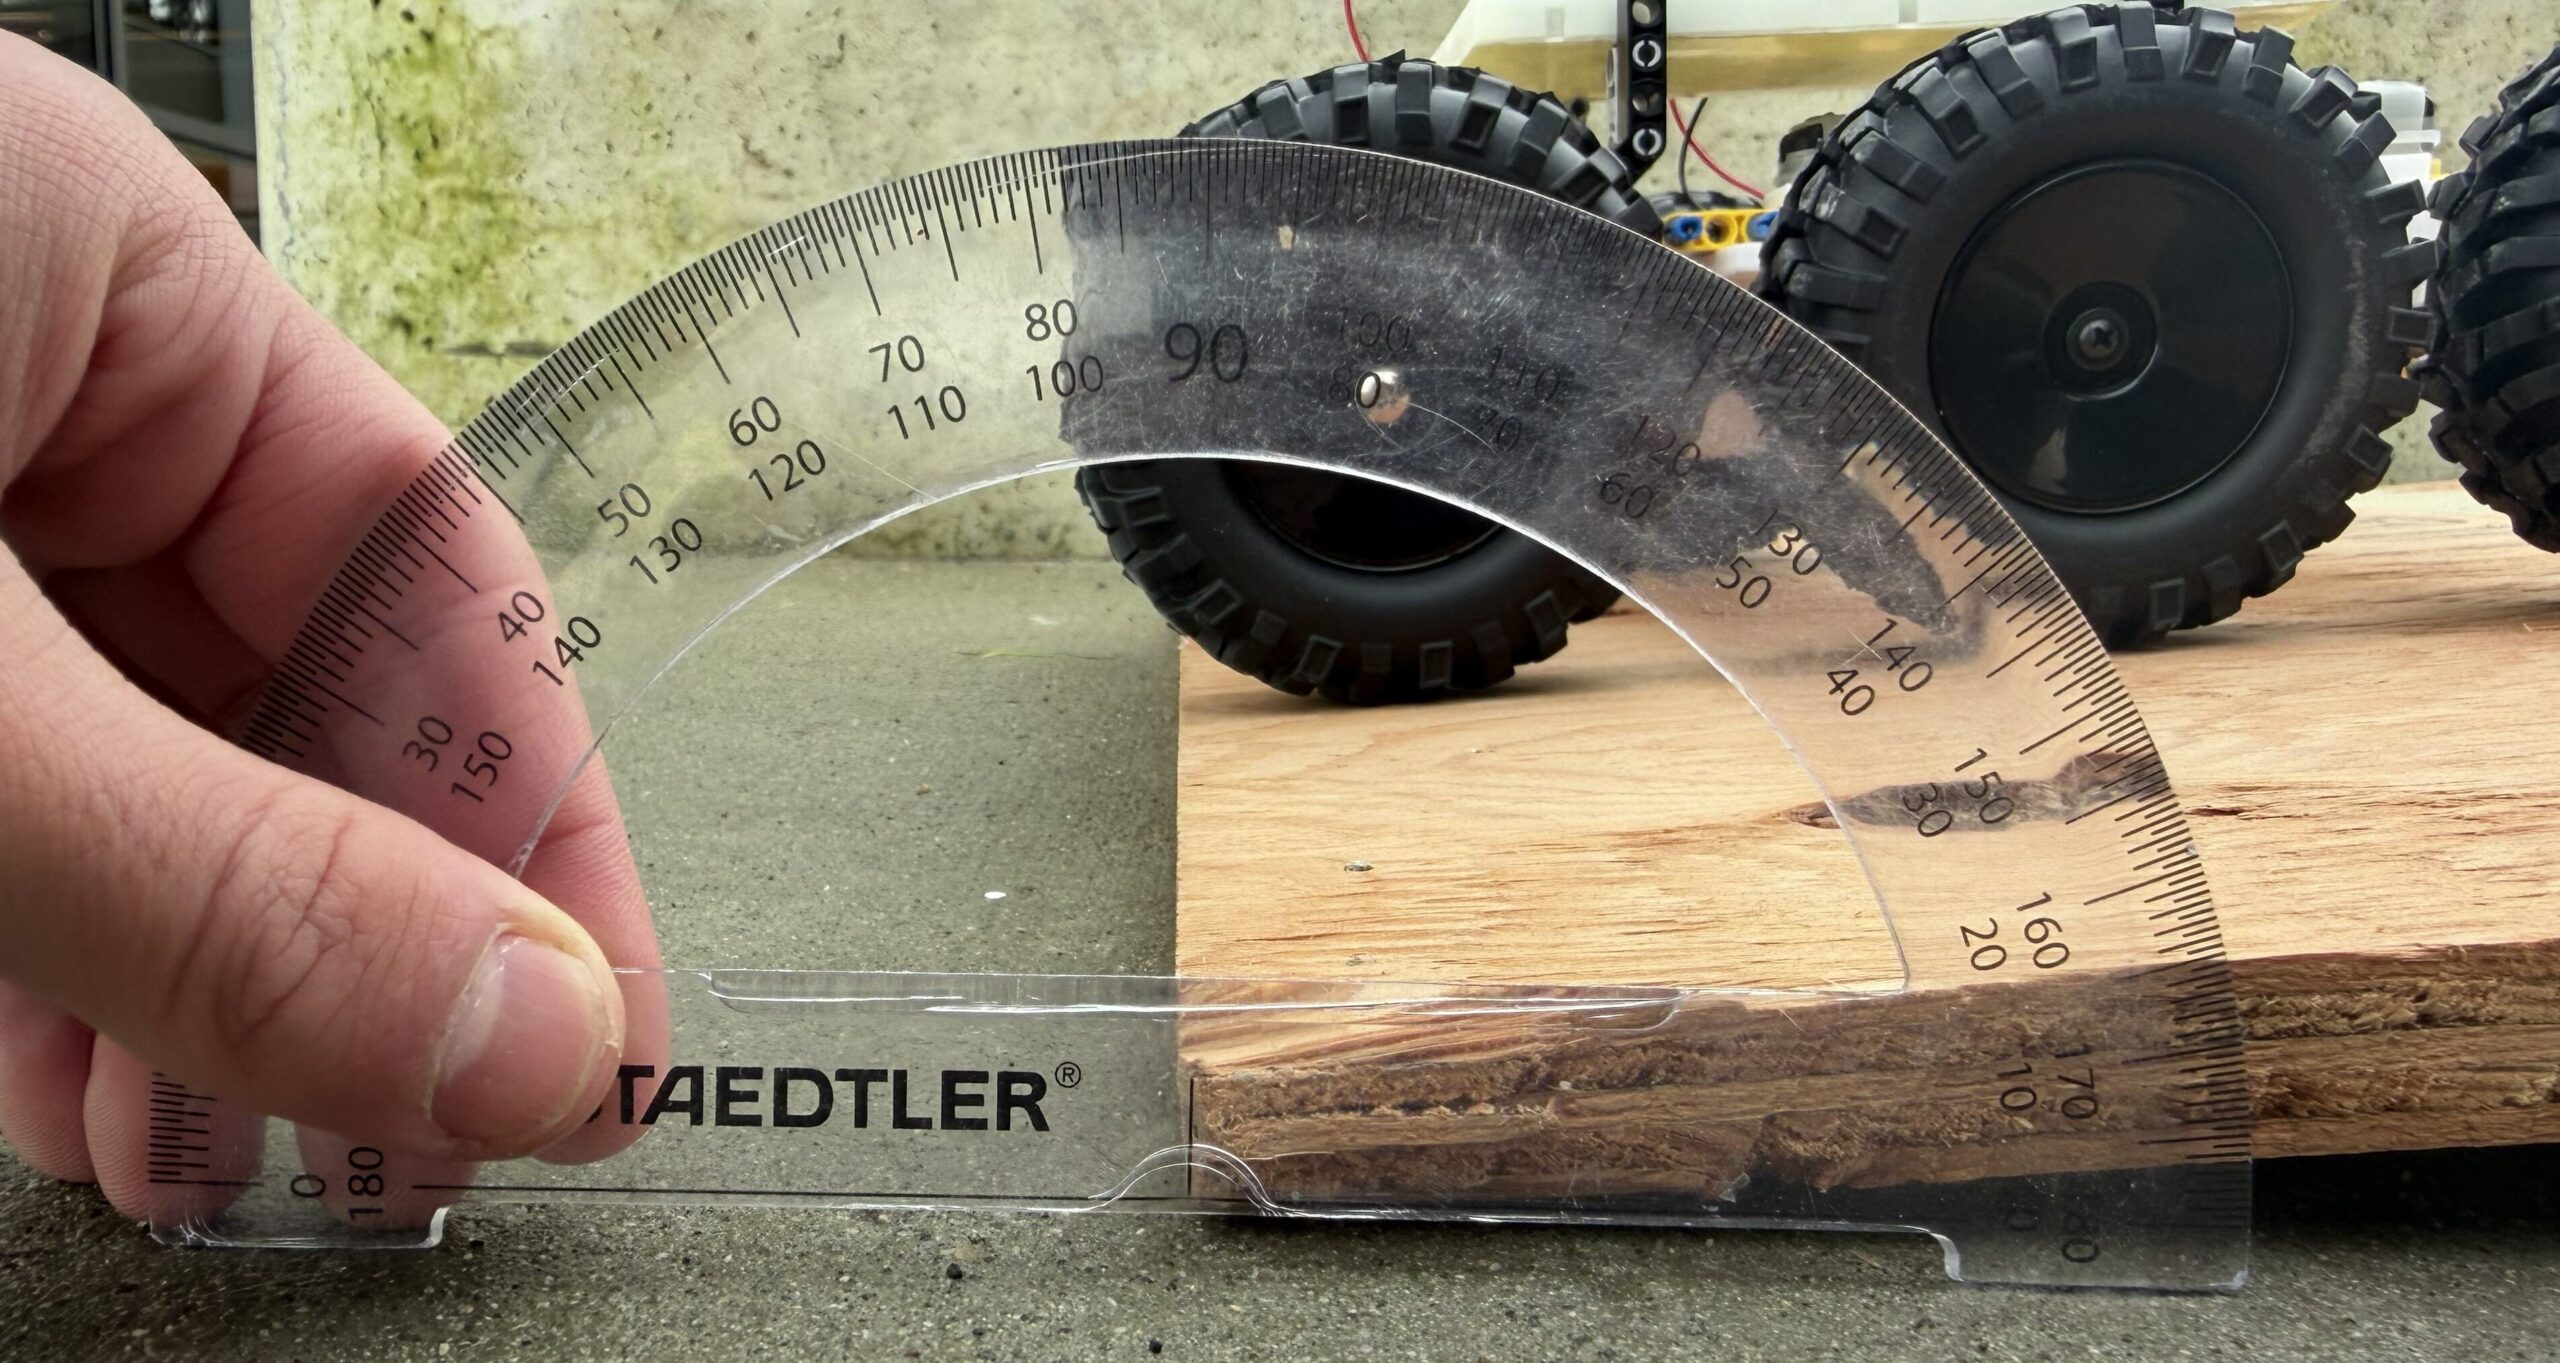
Small Incline Test (Challenging Scenario)
This incline had a 7.4cm rise and waa 6.5 degrees from the horizontal.
| Time – Test 1 | Time – Test 2 | Time – Test 3 | Time – Test 4 | Time – Test 5 |
| 1.692 s | 1.742 s | 1.601 s | 1.559 s | 1.592 s |
We can get how much extra energy the incline scenario needed by:
- Analysis and Conclusion
As expected, the tests indicate that more energy is required for an incline situation. However, the 53% increase in energy consumption for climbing a small hill suggests that the prototype is highly inefficient, or that the tests contained errors and should be improved—for example, by testing over a longer distance and measuring voltage and current in each trial. In addition, a decline scenario should be tested as part of future work to better understand energy consumption across various situations.
Energy Efficiency Test
- Formulas
Energy efficiency is a measure of the ratio of the gained gravitational potential energy from a certain extra energy the motor uses, calculated by the formula:
m is the mass of the vehicle.
g is the gravitational field strength.
Δh is the height change. uses the formula from distance efficiency.
- Test Design
Initially, I was challenged by how to calculate energy in and out, because based on what we learned in science class, the would always be zero in the flat case. This would imply zero efficiency which does not make sense to this test.
The idea is to use the flat case as a baseline and test the energy efficiency on an incline terrain (Δh=7.4cm). This gives us how much extra energy it uses () to gain height. We can calculate the potential energy (
) of the height increase. The percentage of the potential energy and used energy will indicate the energy efficiency.
- Data Collection and Calculation
Uses the same data as Distance Efficiency.
- Analysis and Conclusion
This data means that it takes 100J just to gain 3.6J of gravitational potential energy. Again, this result indicates that the prototype is very inefficient, or there are test errors. This reflects the same conclusion of the distant efficiency test.
Friction was one of the biggest factors of this low efficiency. Energy is lost throughout the many layers in the system. The initial electrical energy is transferred into the motor and through its gearbox to become rotational motion. This rotational motion goes through many axles and the universal joints, to get to the wheels.
STAGE 5: Implications on Proxima Centauri B
I will now extend our findings of Distant Efficiency to estimate how much energy is needed for a 10km round trip for a larger vehicle on Proxima Centauri B.
Firstly, I need a rough model of the large vehicle. I will assume that the vehicle will be ~10 times bigger. I will estimate the large mass .
Scenario One: If the surface is roughly flat, the stronger gravity will have no effect on it. So, the estimation of distance efficiency is:
Scenario Two: if the surface contains one-third of flat, one-third of small incline, and one-third of decline, and in the worst case scenario, the decline distance efficiency is the same as the flat. I also had to consider the impact of increased gravity (1.3 times of earth gravity) on the distant efficiency of incline case.
Assume it is proportional to the increased gravity, so
So, the estimation of distance efficiency is:
The energy needed to travel the 10km round trip on this mix terrain is:
According to my research, 1 kg of battery is required for every 150 Wh of energy. The required battery mass is 1300kg. This is significantly heavier that the vehicle already and it does not consider the increase in total mass caused by the battery. The real battery would have to be even bigger.
We are assuming that Proxima Centauri B has a thinner atmosphere. This would decrease air resistance; however, we didn’t consider this factor for two reasons. Firstly, the prototype doesn’t have an outer case and is very open. The real vehicle would definitely have an outer shell to protect the passengers, so the air resistance would be larger. It would be to complex to model the air resistance along with the thinner atmosphere, so we simplified the model to assume similar effects of air resistance. Secondly, the real vehicle is not designed to go fast on uneven, rough terrain. Air resistance would not effect efficiency a lot at relatively low speeds.
In the future, the work should focus on the development of far more efficient vehicle designs and lighter, higher-efficiency energy sources.
Conclusion
I enjoyed this project, especially the design and build stages. However, the result was not quite as I expected. I believe I could learn more and improve the design further with more time for testing. All of the “failures” during this learning experience have taught me that engineering design is rarely straightforward and often requires forward thinking, extensive trial and error, and working within practical constraints.
If I were to continue working on this project, I would consider the following improvements.
Design Stage
- Stronger Prototype Materials – 3D printed parts have limitations in strength, precision, and connection. Some of these have already been detailed in this report. Primarily, the parts kept falling off during testing, and the prototype wasn’t very durable. These significantly affected test consistency and performance. Next time, I may want to experiment with using metal.
- More Power – I originally started with a 4.5V battery and it really limited the prototype’s ability on inclines. I switched to a 9V battery and its performance signifcantly improved. However, it still struggles on a little steep slopes. I may want to use higher voltages in the future to counteract this, but this may raise some safety issues.
- Less Friction – Friction was a major contributor to the low efficiency. This could be done by adding bearings or lubrication, or simplifying the system and the number of layers.
Testing Stage
- Reduce Test Errors – The such low efficiency in the Analysis stage may be due slightly to testing errors. I would adjust these tests by:
- Testing over a longer incline, hopefully 5 seconds or more.
- Constantly measuring current during the incline, rather than at the beginning and end of the tests.
- More repetitions of tests.
- Testing more different angles of incline, including declines.
- Adding gravel and rough terrain to the incline tests as well.
- Deeper Suspension Testing – The original suspension tests were very simple and uninformative. It would be better to have multiple parameters to change and compare, such as wheel size, spring stiffness, and suspension range. Additionally, I would test multiple different terrains, including a much more chaotic and bumpy one, to test the limits and advantages of my suspension.
AI Transcript:
I used AI to check the energy density of the optimal electric batteries.
https://drive.google.com/file/d/1xbxV6a-SEAxV52y1ae43ZQXy6yycOmuB/view
Leave a Reply to Ms. Holmen Cancel reply