I have recently pivoted my problem from designing a guide for blind people towards combatting excess recovery time by making a 3D printed cast with the implications of PEMF built in. This problem is being solved for primarily athletes which could enable them to recover damaged tissue and bones faster with the use of pulsed electromagnetic fields. My definition statement is
“When designing a cast with implications of using built in PEMF to enhance tissue and bone recovery I must consider the strength of the elctromagnetic field, the safety of the device, and the many prototypes that must be made to make the 3D printed cast function.”
Research
I have gone over the internet and researched whether PEMF was made into casts before and turns out noones ever attempted it. After this first bit of research I began to look into the implications of PEMF in a cast. This system would allow athletes to power on the PEMF device for hourly segments throughout the day to incrase bone recovery. This choice of hourly segments is to provide extra safety as studies have shown that if constantly being in a PEMF it could cause small excess bone and tissue fusion limiting mobility. However these results were only produced by people over 50 or smokers meaning for the average young athlete this would not be a problem. I also used the FDA’s official website to verify whether PEMF is safe for humans and since the 1980’s all the cases done have returned back with PEMF being deemed safe in medical use.
My solution to the problem is to make a cast that will incorporate PEMF which would allow for bones and damaged tissue to recover quicker because of the presence of a controlled, pulsing, electromagnetic field. I will 3D print a cast that will hold a magnetic coil which with the press of a button could send a pulsing signal of power to the coil with the help of a arduino to control the device. I will test my progress against my definition statement by fabricating a 3D printed cast that can compress my arm, hold all the components for a PEMF device, and if I have extra time I may test if PEMF can increase my rate of muscle recoverery after working out the verify if this PEMF device in the cast actually functioned.
My Progress
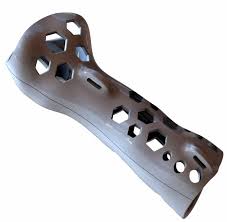
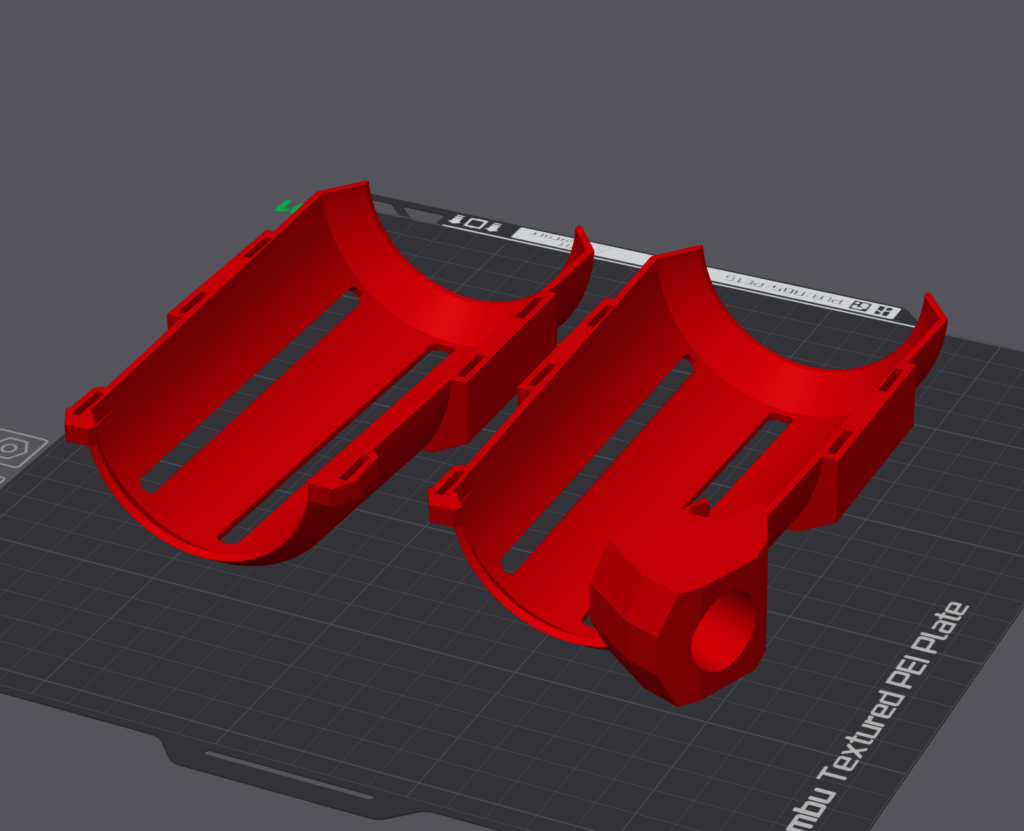
Aftere doing my research I have began to make a BOM while also making my first CAD Protoype. Keep in mind that my cad protoype is not going to be made out a a flexible PLA and that the use of cushioning inside will be present unlike the 3D printed cast shown above.
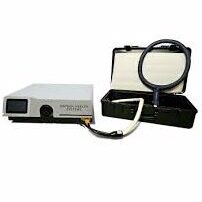
My BOM is incomplete but I do know I will be using rectangular magnets to put on and remove the cast. I also know that I’m using an enameled copper wire to create the electromagnetic field.
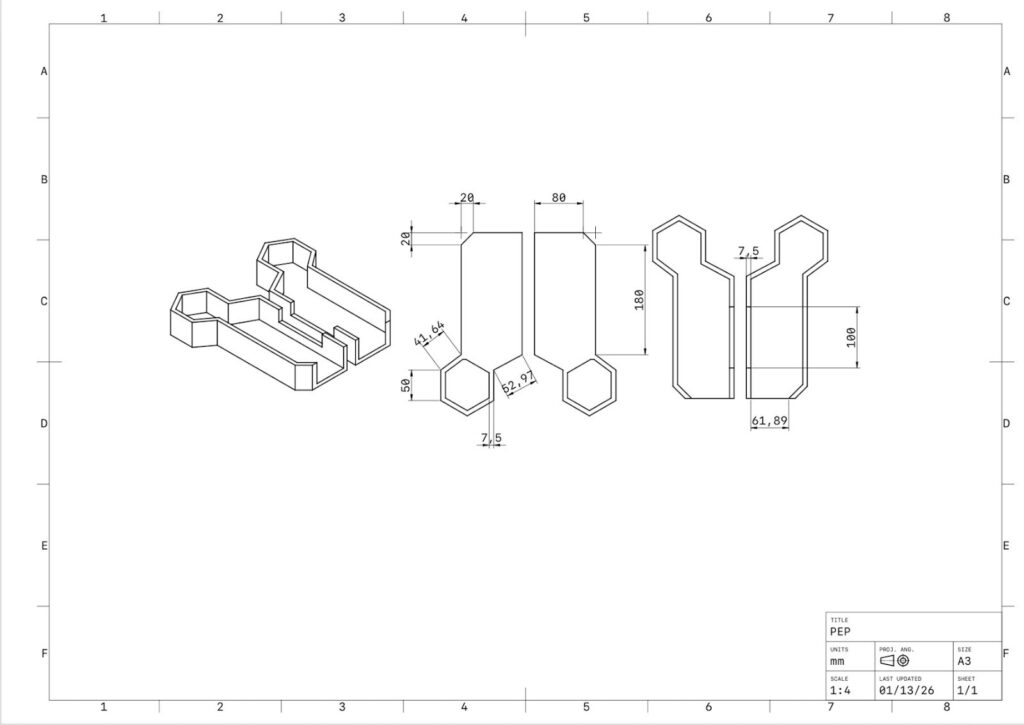
Images listed below:
Forseen Challenges
I know that I will need to leave myself time to create the circuit for my prototype. I would think this could take me one week but I anticipate it will take me weeks to create a prototype for the cast that works especially with the challenges I’ve experience when designing the thumb portion of the cast.
Next Steps
I will need to complete my BOM, print my first CAD design, and create another couple CAD designs over the break to allow me to have enough time to create a functioning cast and to implicate a PEMF system into it.
Blind people are often held back by doing many activities in life and are forced to find ways to combat ones loss of vision. On the road simple walking sticks can be used to identify terrain alongside a guide dog who could find terrain shifts and notify the blind person about them. In skiing blind people are forced to hire guides which can cost a lot of money due to both the risk factor, and the fact that guides would have to spend their whole day guiding around. Due to this skiing is not a very accessible sport to blind people. Because of this problem I have set out to create a vest that serves as a guide for blind people traversing terrain and maybe even skiing.
The Solution
Over the past month or so I’ve spent a lot of time researching image recognition technology in hopes to implicate an identification software that could also create a safest way to a destination. Some ideas I have are to make a vest that can hold the components or to make the components to fit inside a small box able to be easily put in a backpack.
After researching possible ways to solve my problem I made my definition statement which happens to be listed below.
“When designing a device for aiding those who are visually aided in doing everyday activities such as skiing I must consider the critical problems of sensors functioning at high speeds, vest weight being light, creating a system that can analyze terrain and create the safest path, and designing haptic gloves to communicate the software’s thoughts to the user.”
The Plan
To make my prototype I will need to find time to build the device/software, learn how to code an image detection, and pathfinding software. I believe that learning how to code these softwares could take up to or well over a month so its important I do as much planning as I can in advance to make the design process of the actual prototype much quicker.
Below is a task list covering what the order of completion must be
Research raspberry pi boards and choose which one to use
Create a BOM and look into what components I need
Begin software creation with component choices in mind Estimated Completion:Early April
Test the softwares basic functionally by walking blindly
Look for any errors in the software and make edits
Create the CAD vest 1st iteration
Test the efficiency of the CAD vest design
If design is poor create a new model if not choose a light but strong material to create another prototype
Could be the end here but if I finish the walking vest beforehand I will begin to test the vest in other places such as a ski hill while making more improvements to the design.
Overall looking back on my planning its become evident that the creation of my softwares is a dangerous variable being able to both work perfectly the first time or to never work once making my life 100 times harder. I know that the sooner I begin learning how to make these complex softwares, the sooner I can begin working on areas where I have more strengths such as designing models and finding a way to best achieve minimal weight and structural integrity.
Our chosen location for the Fusion PEP assignment was the celestial body known as Titan (Saturn’s largest moon). We chose this celestial body due to the many natural features such as an atmosphere, large hydrocarbon reserves, and being able to easily create and sustain oxygen production via the materials and compounds spread along the moon’s surface. However their were also many challenges we faced in the theoretical science portion of our projects which we addressed in our definition statement.
“When designing a vehicle suitable for Titan, the critical problems we must consider are its ability to accommodate 4 people and its machinery under extreme temperatures of -180°C, hold sufficient energy to travel distances of 10km at a time, be able to produce oxygen, and have sufficient traction to grip Titan’s unique surface of ice, dunes and pebbles alongside combating the lower gravity similar to the moons.”
From our tests we hope to find our vehicle efficiency which we will calculate using a video analysis software. From this data we hope to find the optimal ratio from weight to size to battery power for our vehicle to successfully traverse Titans complex and sandlike terrain. We also hope to find the efficiency of spiked treads on sand. We will be testing this by creating an accurate terrain replica of titan’s surface and testing our vehicle’s movement capability’s. This terrain was replicated by both a slippery white board and a board covered in sand.
After our research and construction of our PEP statement we made a sketch iteration of our design before I finished our BOM and began experimenting with the robotics components of our design while another group member built the skeleton design of our vehicle. Throughout the early stages of this project I demonstrated leadership skills by analyzing my groupmates strengths and having them work on certain parts of our project while at the same time guiding the creation of the CAD design and creation of our BOM (Bill of Materials) Table.
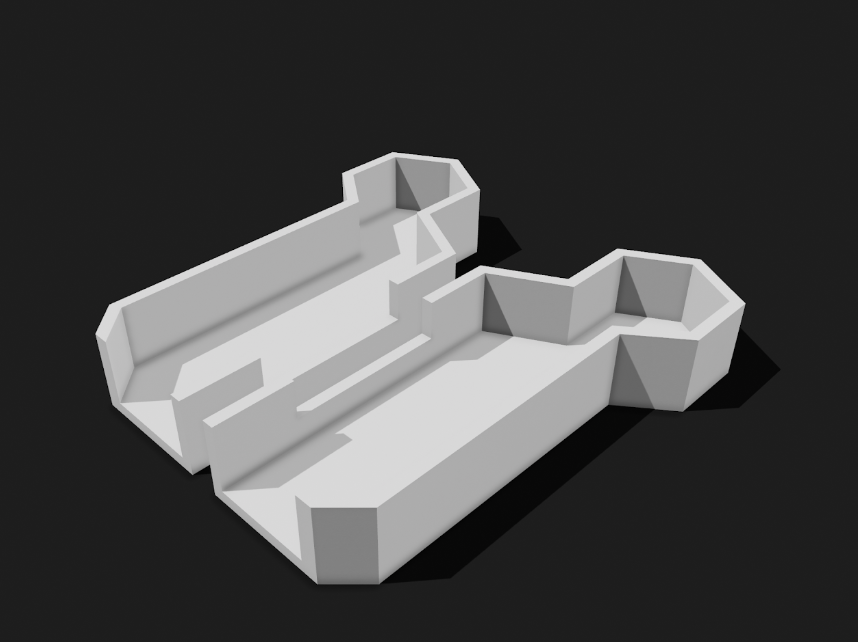
Below are photos of our original CAD design alongside our test plan. This CAD design was designed to be 3D printed with all of the components stored inside the large base. For a practical use we implicated a raised hexagonal head to serve as a lookout and control center for our vehicle.
Our tests were designed to allow for traction to be tested on terrain similar to ice sheets and shallow sand. We will use a piece of plywood covered in kinetic sand made to implicate dunes to recreate Titan’s desert. The dunes will allow us to test whether our vehicles spiked treads could traverse vast deserts. We will use a whiteboard to test the spiked treads traction along a slippery surface.
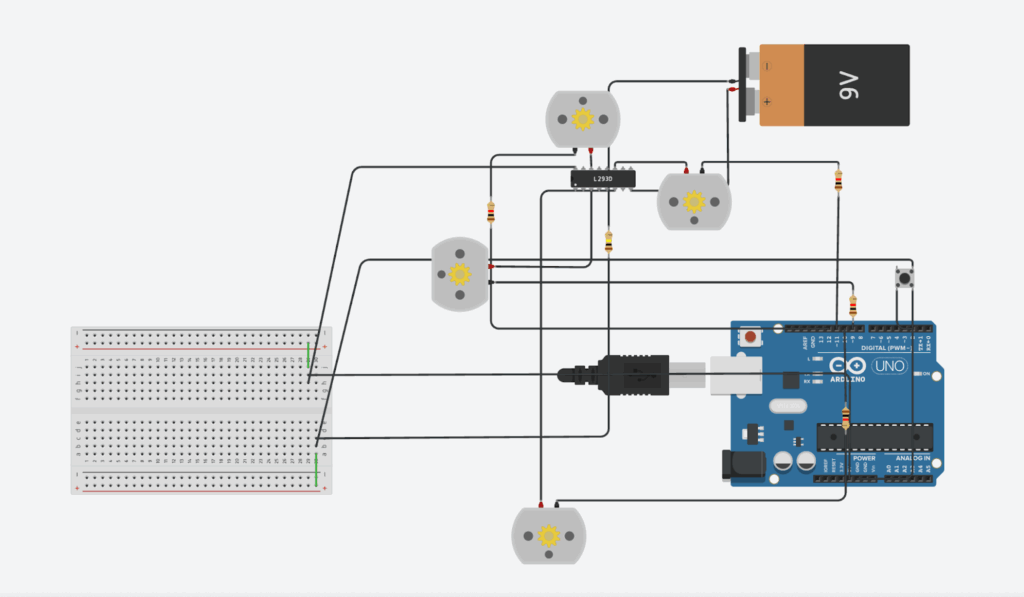
Ontop of our designs body and functions we needed to create an arduino system to balance the energy between our 4 motors. Our system relied on a motor driver dividing up power between our motors to prevent an overload that could possibly cause our wires to light on fire. This motor driver took inputs from our arduino board and moved the motors when a button was pressed an odd amount of times.
Below is a digital rendering of our circuit in tinkerCAD and a link to our arduino code
Although my group made impressive progress in our planning stages and had set our eyes on an ambitious design we soon realised we could have overcomplicated our design. Unfortunately our first vehicle prototype did not function on our first test day due to four main problems which had to do with our code, enclosed design, weak axels, and our original print mistake. Our code did run smoothly in our online simulation however when it came to building our prototype we found out the motor driver was unable to divide power evenly and simply just overloaded causing the circuit to be completely immobile. Following this failure we tried to pivot last minute and were unable to fix this problem for this prototype. However, we gained inspiration on how we could make the arduino code the minimal viable product (MVP) that still solved our problem. Our enclosed design made it very difficult to put together the circuit inside of the vehicle causing us to waste time trying to configure our design. As we managed to put together our design we soon realised that the wooden axels were beyond weak and proved to be unable to hold the wheels weight causing them to just snap and fall off. Our last problem had to do with a small problem we faced orignially being a misdesign in our vehicle body. Originally we were meant to have the motors come out of the bottom of the vehicle but our file wasn’t saved properly and this big hole dissipeared. We then spent a long time trying to drillpress holes in the side of the vehicle only for the wheels to barely touch the ground deeming our vehicle non functionable. These many problems and the crushing feeling of failing on test day motivated my group and I to knock our next iteration out of the park.
The First Test
Come the first test day my group and I knew our vehicles ability to function would be abysmal but we at least hoped it could move with some last minute adjustments. After going through our test it would be safe to say our vehicle did not function however, this didn’t mean we failed to make observations and learn from our mistakes. To fully understand how we could improve our vehicle design we first had to ask the question, what went wrong?
Our poor design choice of using wooden axels and attempted pivots only weakening the vehicles ability to function led to many other problems to arise deeming our vehicle fully immobile. We also noticed our treads not being able to hold the hot glue inside them, preventing us from attaching our treads.
Onto the flip side we noticed our motors and batteries worked due to our minimum viable product design. We also came our of this test knowing how we could improve our vehicle. These improvements consisting of using metal axels in the motors, using rubber bands and ridges in the wheels for traction, and using a more open body allowing for us to access components more easily.
The Final Prototype
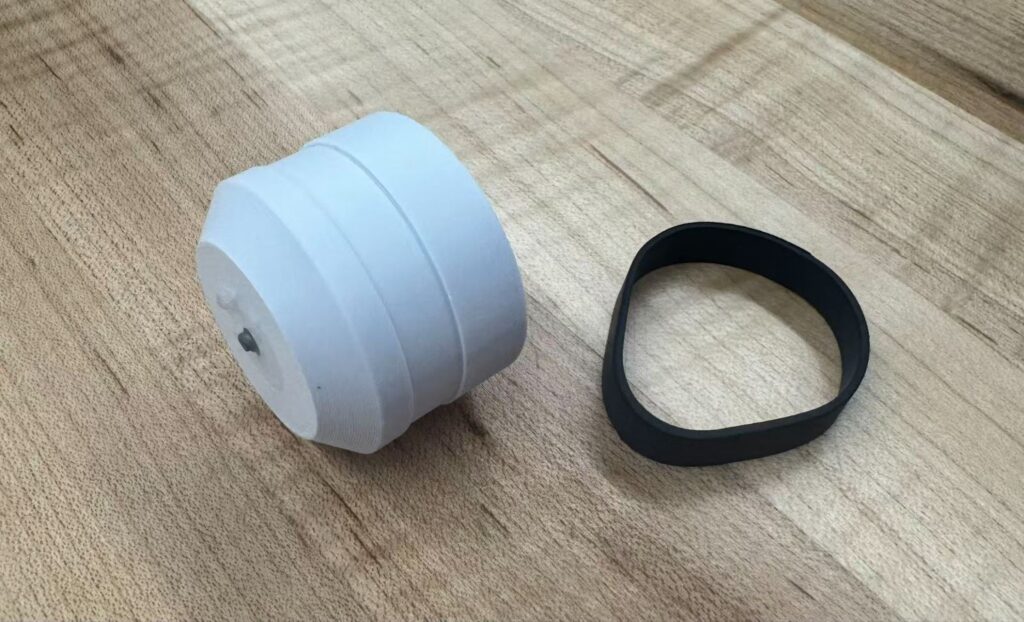
Our final solution was a collective of all of our improvements planned out following our first tests failure. To fix our issue we originally faced with our treads not attaching to the wheels we decided to make a new wheel design printed out of a stronger PLA with a ridge meant to fit a rubber band allowing for better traction. We also decided to drop a motor and take our vehicle from eight wheels to six. To support our vehicles immense weight we made metal axels by using an electric saw
Our new vehicle body was laser cut out of plywood allowing us to reduce vehicle weight hence increasing our vehicles efficiency. We also noticed our new prototype experiencing problems when attempting to go straight so we added some square dowels on the edges of the vehicle to spread out weight which somehow fixed our vehicles problem relating to its traverse path.
The Final Test
During our final test we noticed our vehicle exceed our expectations by working flawlessly along all of our tested terrains as well as noticing our vehicle could climb inch high walls and could traverse a rocky surface in which the vehicle was unintended to do. Our vehicles counterweight and long design allowed for the vehicle to stay stable along different terrains as well as proving to be efficient from our test data in our video analysis app.
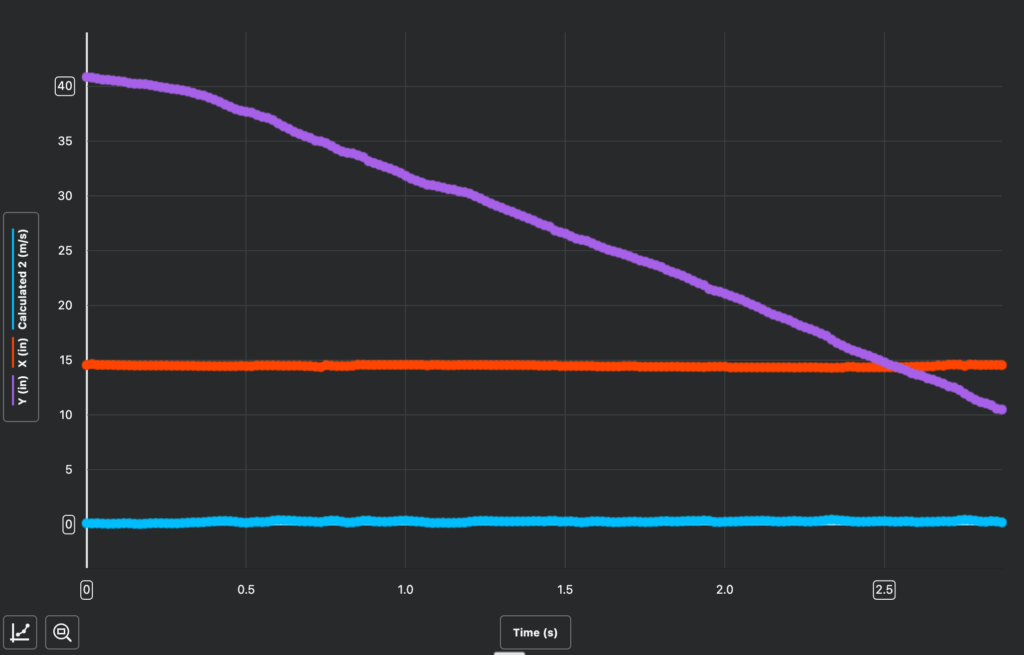
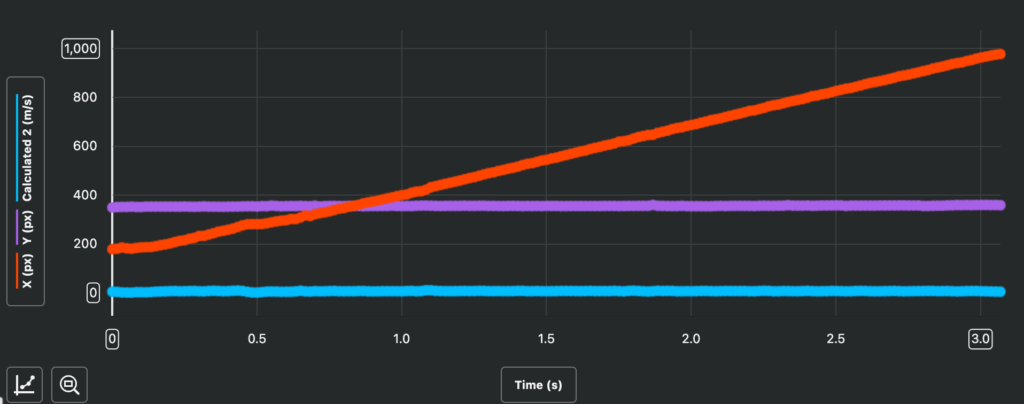
Below is a photo of our graphs and data taken from our video analysis tool and a link to a spreadsheet covering our data.
After our main tests some other quick measurements were taken of the vehicles weight, voltage, and amps. These measurements came out as 506.7 grams, 7.34 volts, and 0.52 amps.
From our data we were successfully able to determine our vehicles speed across both terrain’s which was listed when we made an average of the collective speed in both in/s and m/s in the video analysis tool. From this we were able to find out that on the sandy terrain our vehicles velocity was 0.28 m/s on sandy terrain and 0.34 m/s on the ice terrain. After we have some basic data relative to our vehicle’s speed we now must find the vehicles energy efficiency. Now what is energy efficiency? Energy efficiency is using minimal energy to complete a task. In our case the energy efficiency percentage is counting how much of our energy is being used to its capability. For a project like this the energy efficiency could range from 0.1%-1%. To find our vehicle’s energy efficiency we first have find values for both input and output energy. The efficiency formula is output over input energy. Input energy is by definition the total amount of energy applied to a system so in our case we would find this by multiplying our voltage by our amps. By multiplying our voltage of 7.34 volts by our amps of 0.52 we are able to find out that our vehicles input energy rounds up to 3.82 joules of energy. To find our vehicles output energy we first need to understand what output energy is. Output energy is the total energy of kinetic, thermal, and light energy. In our case no thermal or light energy is being emitted meaning our vehicles output energy=its kinetic energy.
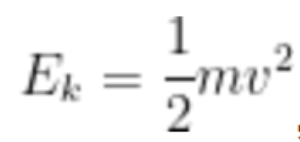
To find kinetic energy we must use the kinetic energy formula which is
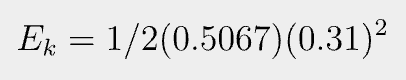
After putting in the mass of our vehicle which is 506.7 grams and the average velocity of our vehicle across both the ice surface and sand surface we can simply multiply everything together to find the kinetic energy. By adding up the two velocity’s and dividing by two we can find the average velocity across all terrain of our vehicle. (0.28 + 0.34)(1/2)=0.31 so our vehicle’s average velocity is 0.31 meters per second. Now that we have the velocity we can put everything altogether giving us
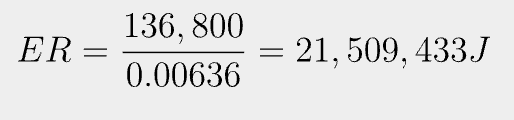
After rounding to three decimal points we find the output energy = 0.0243 joules. Lastly to find our vehicles efficiency we will do output over input which is 0.0243 divided by 3.82 which gives us about 0.00636. Lastly we multiply 0.00636 by 100 to turn it into a percentage which means our vehicle’s efficiency is around 0.636%.
Below is a link to the equation editor I used to formulate my calculations.
From this project I’ve come to learn so much about physics, vehicle design, celestial bodies, and being able to make simple and smart implications to projects. I can draw, that with other ways to solve some restraints such as travel time our vehicle could traverse Titan. We could also use the property’s of hydrocarbons to create large amounts of energy powering the vehicle but however, would have to find a way to cause electrolysis with allowing for a sustainable oxygen source. Overall I would call my groups attempt at our planetary exploration project to be quite successful. Though success on small scale tests cant dictate whether our vehicle would function on titan so instead we need to do some calculations. To correctly find the fuel required for our upscaled vehicle to traverse titan I need to go into some physics material that wasn’t fully taught this year. To find the fuel needed for our vehicle to travel 10 kilometres we must first find the vehicle scaled up mass, then find the force applied upon the vehicle, and lastly divided by efficiency. The vehicle mass is 0.5067 kg so we times that by 10 the the power of 3 which gives the scaled up vehicle a mass of 506.7 kg.
Now we take the mass and multiply it by both the gravity and the rolling resistance coefficient which is 0.02.
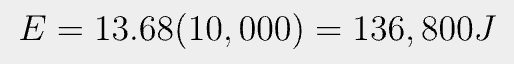
Now we need to find the energy for our vehicle to travel 10 km which we can find by multiplying force and distance.
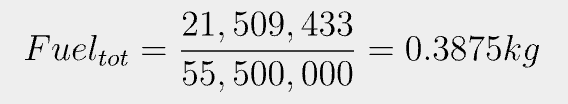
Lastly to find the fuel needed we must take the energy, divide by our vehicles efficiency, and lastly divided energy required by the density of the type of fuel (the amount of energy J/kg stored in the fuel source).
First I find the required energy
Lastly I take the energy required and divide by the energy in the fuel I’m using which in this case is methane coming from Titans large lake reserves of it.
After doing these calculations I now know that my vehicle would need 0.3875 kg of methane to travel ten kilometres which is fully within reason further backing up why my vehicle would function on Titan. Due to the theoretical success I don’t believe many changes would need to be made to my vehicle to help it traverse Titan.
Although when looking back, this project was deemed successful that doesn’t mean our vehicle couldn’t have been better. Based on what I’ve learned about energy efficiency and vehicle design I would have liked to make the vehicle’s body be lower to the ground with a triangular design to increase vehicle balance and to lower the vehicle’s weight. This change alongside moving the heavy components more centrally would allow the energy efficiency to rise making our vehicle even more suitable for Titan. Although if a new environment and new redesign would be to occur I believe it would be quite interesting to work with a vehicle that tunnels under deep sand deserts via air propulsion and a large drill pushing sand.
Lastly, throughout this project I’ve learned that the more times you test the more you can learn which is a valuable lesson I will be carrying with me into my personal project.
In fusion we have finally started our first large scale and group project. In this concurring project we will go through multiple steps contributing to a common goal of inhabiting a planet, moon, or star. After locating a planet we will design technology and even a vehicle to improve life on our astronomical body.
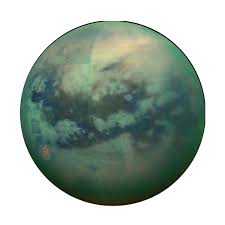
After my group and I began research we found multiple moon’s and exoplanets fitting many of the requirements for life. In the end we chose to dive deeper into Titan (Saturns largest of 274 moon’s).
Photo is a no background png of Titan captured by NASA
What is Titan? Why did we choose it?
Titan is Saturns largest moon known for it’s freezing temperatures and nitrogen atmosphere (One of only 7 celestial bodies in our solar system possessing a nitrogen atmosphere). We decided to pursue research in Titan due to it’s distance from earth, and many necessary factors for life it contains. Titan is still within our solar system and takes only 6-7 years to arrive via rockets. The nitrogen atmosphere surrounding Titan protects it from radiation meaning if ways to combat the cold and no oxygen were found we could breath. The gravity on Titan is lower than earths gravity 9.807:1.352 but with way to get high calcium bones will not lose density. The ice on Titan could be melted with proficient levels of heat giving us water and the natural oceans and lakes of hydrocarbons could provide sustainable fuel for millions of years. These hydrocarbons possess more than 35x the amount of energy as Earths fossil fuel reserves. Lastly a chemical reaction of 2H2O ->2H2 +O2 would allow for an abundance of oxygen to be created on Titan.
Linking into why we chose Titan are the opportunities we can seize with resource abundances and colonization of astronomical bodies. On the case of opportunities to improve life on Titan the nitrogen atmosphere and severe amount’s of ice and hydrocarbons provide us with many of the needed factors for life. On the other hand opportunities for research such as learning about Saturn and the sustainable energy source in hydrocarbons could benefit our life on Earth as well.
Although Titan proves to have many factors for life to be sustained it lacks a few. I’ve already thought of ways to solve the lack of oxygen problem on Titan but the cold temperatures (-160 degrees celsius) prove to be a tough problem. I also believe that it would be impossible to flow oxygen throughout an entire celestial body with the ice on Titan. Because of this I know building a 300x300m dome to contain oxygen would benefit our chances of inhabiting Titan.
With our current ideas for exploring Titan we couldn’t have humans walk across the moon so having vehicles would aid in exploration. We would be able to locate resources, map the moon, and more with a rover of sorts.
Some issues to keep in mind when designing our vehicle are
(And how to combat them and what problems they bring up)
It being able to withstand beyond freezing temperatures, having a way to control it without signals, and the vehicle staying connected to the surface moving along ice or granulated sand. After a short brainstorming process I found ways to combat our problems. We will use cuppnickel sheets (theoretical) to prevent internal freezing of all the mechanism in our vehicle allowing it to function as originally intended. By theoretical I mean that on the Titan planet it would be required but in this project we will not actually test cuppernickel sheets due to their resilience and having no way to mold or cut the sheets. Ontop of this since Titan is in space signals are impossble to transmit and we will have to make the vehicle only move in a straight line when powered on/off. Lastly, due to Titans lower gravity and unique variety of terrain we must make our vehicle with enhanced traction in mind to prevent the vehicle moving into orbit. We will solve this by having spiked treads to both move along thick ice and granulated sand.
Because Titan is an astronomical body located within our solar system we have been able to send machinery and use image observations to gather information. Data has been collected regarding titan from various organization such as NASA and the Italian Space Agency. On two voyage known as the Cassini and Huygens missions many key details were discovered regarding Titan. Using radars scientists were able to map Titans surface through the foggy atmosphere. Infrared imaging techniques were used to support data regarding Titans surface while also breaking down the form of Titan’s atmosphere. The radar scanning allows us to also view the bodies of hydrocarbons scattered along Titan’s surface. Most of what we know about titan was discovered in the past century however, telescopes were used to analyze visuals of titan as early as the middle 16th century. The voyager missions by Nasa occurring in the late 19th century used a variety of tools such as cameras, and spectrometers to gather data. The spectrometer through releasing waves of UV light were able to gather information on Titans below freezing temperatures. Lastly we discovered that Titan had no oxygen by using radio occultation to make inferences about Titan’s atmospheric pressure hence leading to proven data of no oxygen within Titans atmosphere.
Throughout this project I used multiple sources and a partial use of AI when researching my astronomical body, its characteristics, and how we discovered this data.
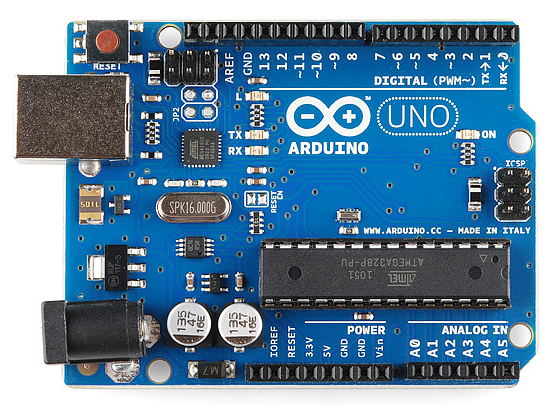
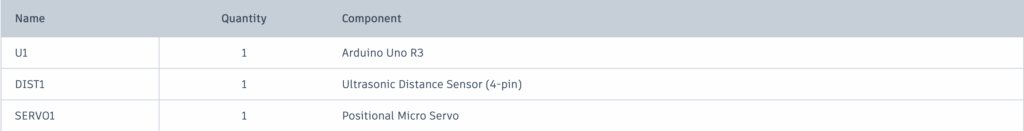
For these past weeks we were asked to deign a robotics project specifically for on an arduino circuit board, in order to learn and demonstrate the necessary skills for us to solve problems later on. The restrictions for this project were loose only being that the circuit had to move (not just LED’s flashing). After noting the restriction I began brainstorming what I would make. After a short period of time I decided to make an attempt at creating an ultrasonic sensor to servo garbage can (in simple terms an automatic garbage can). Before I start walking through my design I believe its necessary to highlight what is an arduino and how does it work.
This is an arduino. Its a small, lightweight, and simple to learn computer board with its own coding software known as IDE (integrated development environment). I know the arduino seem’s to be quite complicated but once you break down the basics it ain’t so bad. The arduino comes with a set of trigger pins following numbers 1-10 used for setting actions to reactions (sensor to motor). More key pins included are the GND (ground or negative current) and the V pins (Positive voltage). Lastly are the analog pins which allow actions to occur depending on voltage.
Now that we’ve covered the basics let’s dive into my design. The automatic garbage can follows a simple system of (motion detected, send a signal through the arduino to rotate the servo). Ontop of making the circuit you would need to make a small garbage can 4x4x8 inches. To make the mechanism work you would also need to glue a popsicle stick to the end of the motor. Lastly you would need to have a one way hinge roof for the servo to turn and push open the bin.
Below I will provide an in depth analysis of my virtual design, the bill of materials table, and my code.
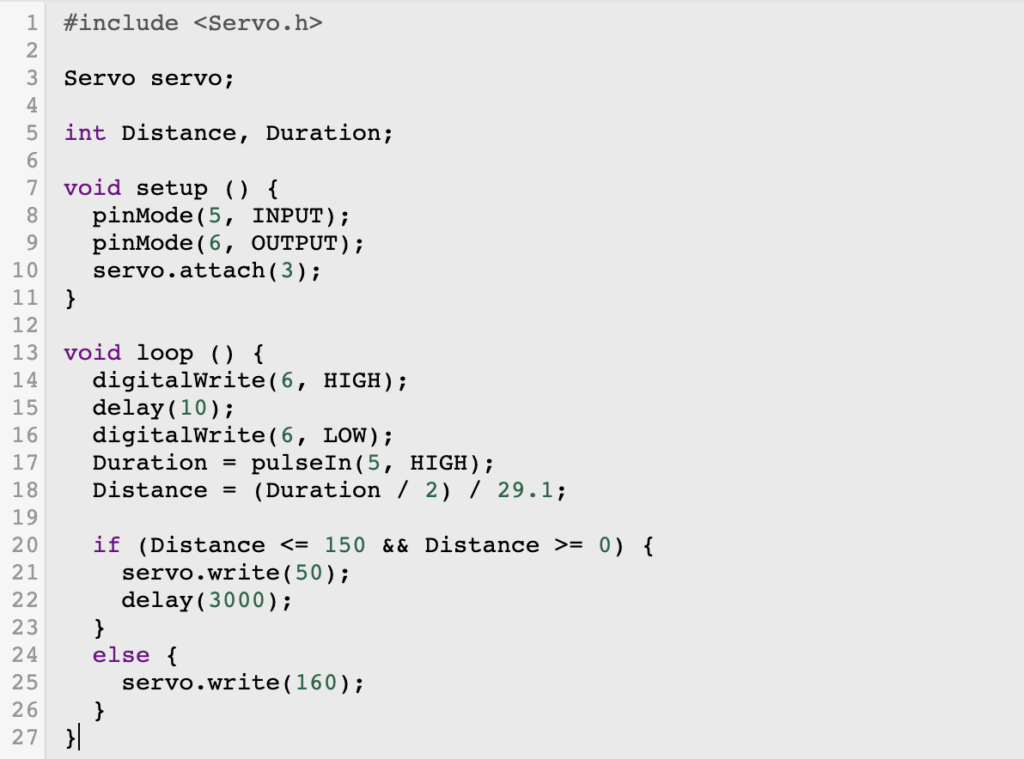
My code contains many common bits of beginner arduino however, it includes a separate library (Servo.h).
In simple terms a library is a pre written collection of code that allows functions to be carried out in a more simple and cohesive matter. This library in my circuit (Servo.h) allows the servo to connect to a digital pin and have it move certain angles. The inclusion of certain angles is why I used a servo instead of a motor. The distance and duration are set as variables to be altered to the users needs which in my case is at a medium distance of 50cm and a rate of holding up for 3 seconds The void setup allows for pins to be set for certain actions which in this case is the receiver and communicator for the sensor’s waves. The void loop function makes it so the actions in the code are constantly repeated as long as the GND and V pins receive sufficient power. The digital write’s and delay functions allow the receiving portion of the sensor and the communicating part to find the interval between actions and use the formula in the code to find a distance in centimeters. The if function sets that if the distance is less than 50 cm then the servo will be triggered to move 160 degrees.
Unfortunately due to a massive problem with the uploading of arduino code on a mac computer I was not able to make my final iteration.
Throughout this project I used no AI
Thank you for reading, have a great rest of your day!
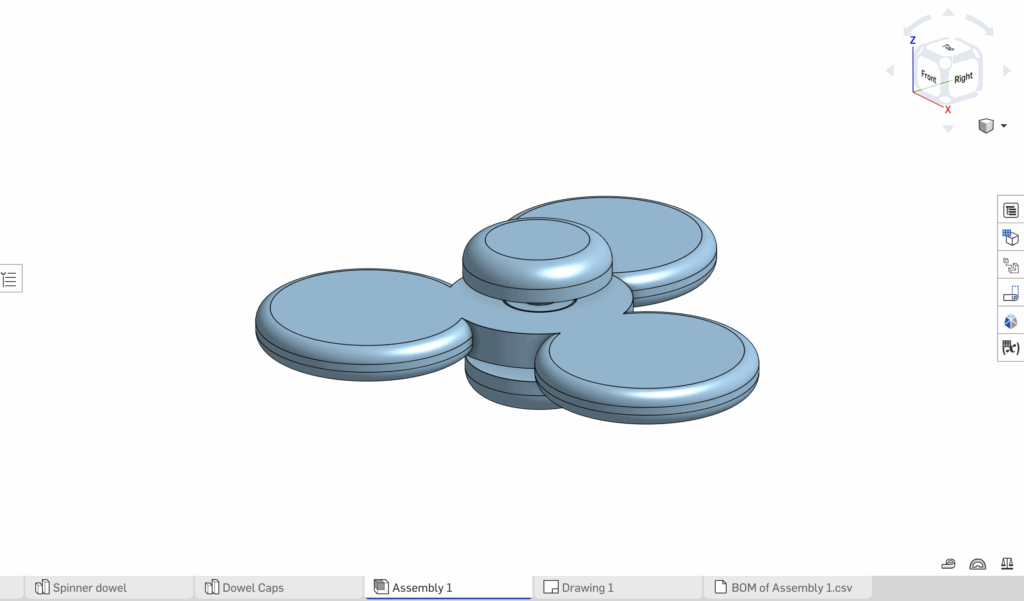
CAD (Computer aided design) is using computers to help build, modify, or analyze digital models. In this assignment we were asked to use Onshape (a CAD program) to design a model of our choice in which doing so challenge our CAD skills. Over the past year I have had experience with CAD programs particularly, Onshape. I have explored the program though a drafting course, maker club, and a robotics course. Because I had prior knowledge in CAD I decided to challenge myself to learn a new tool. Before learning this new tool I had to think of an idea not too difficult but challenges me to use new skill’s. After going through a brainstorming process I had the idea to create a spinner.
Note: The dimensions used in my demonstrationsof creating the fidget spinner are just meant to show recreation of my design and are not correct dimension’s for my final design.
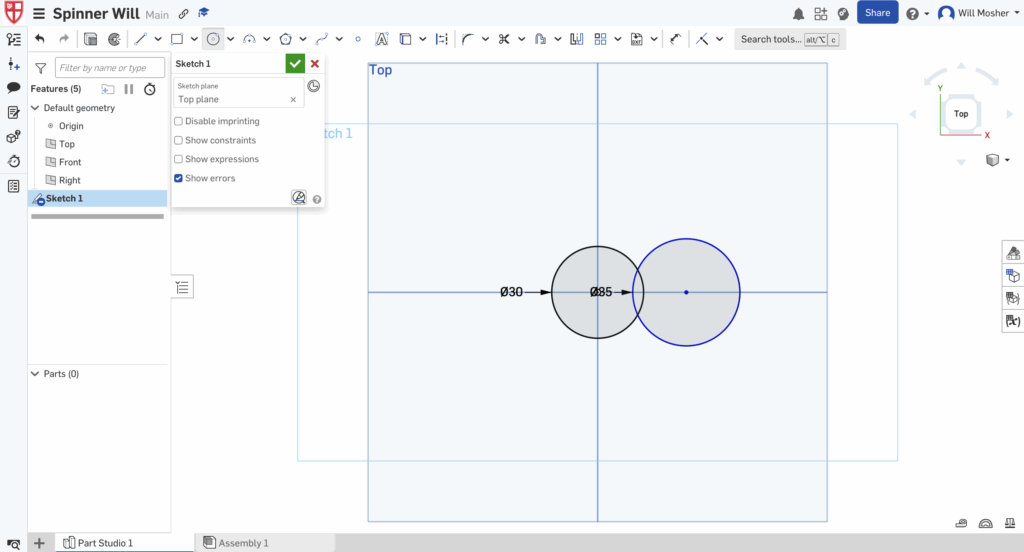
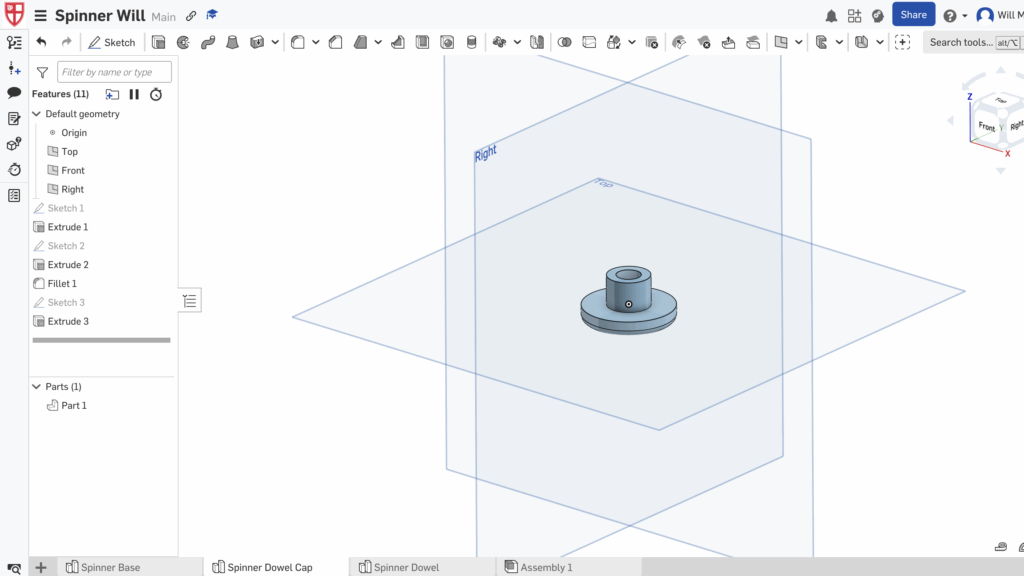
Now that I had an idea of what to create I had to actually bring this idea to life in a CAD software. To start off I need to create a new document and rename it. After this I have to begin making my model however, I can’t just drag in a cube similar to TinkerCAD. I must click the sketch button in the top left corner, select which plane I want to sketch on a use the center point circle tool to make two circles and hover over their dimension’s and type in dimensions to the nearest mm.
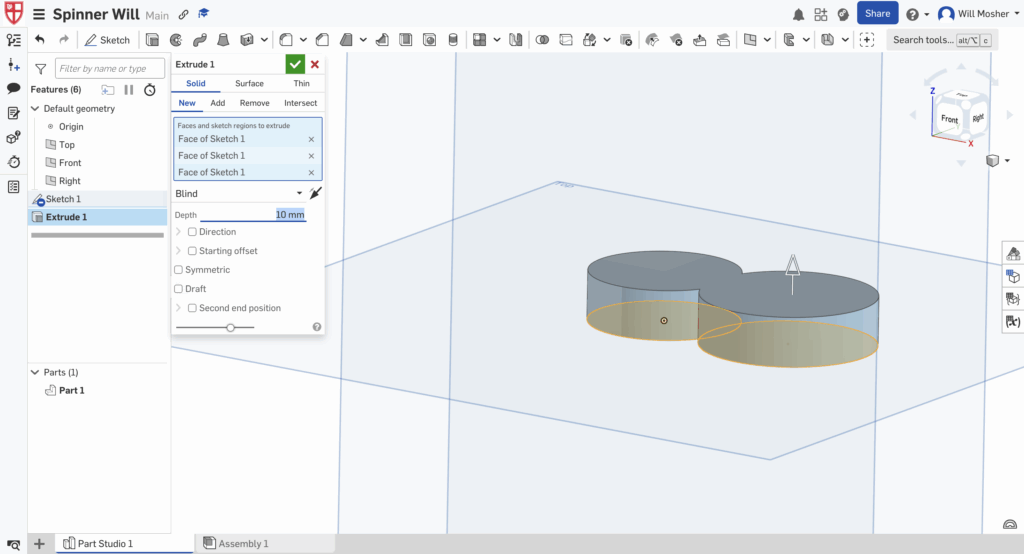
After drawing my sketch I must extrude my design my clicking the extrude tool to the right of the sketch tool. After selecting the faces of my circles I press extrude and type in the desired depth which in this case is 10 mm.
After this create a smaller circle then simply use the extrude tool again except this time click remove and create a hole in the center of your smaller circle.
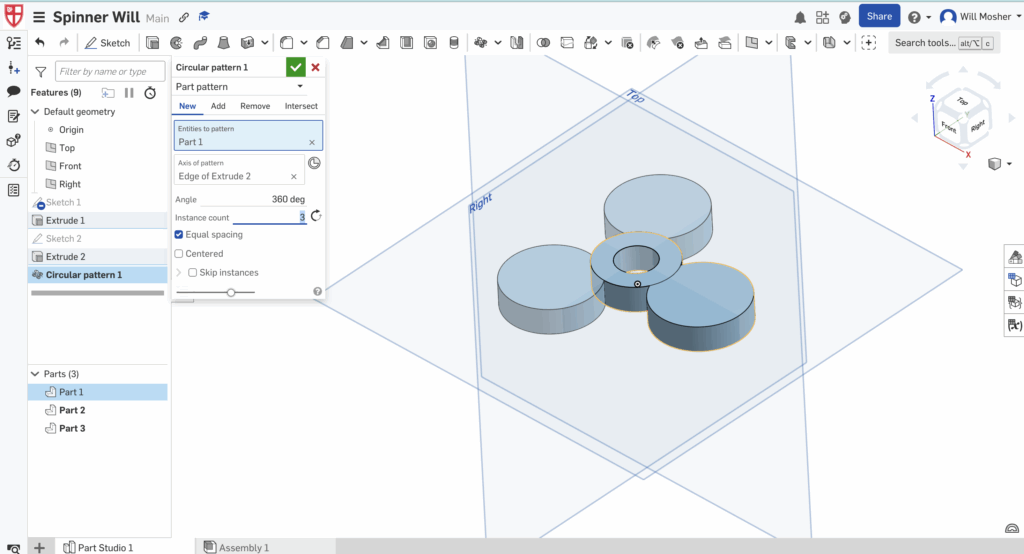
After this I must use my new tool which in this case is the circular pattern tool. First I select the tool and the entirety of my design before lastly clicking the inner edge of my circle with the hole and setting instance count to 3.
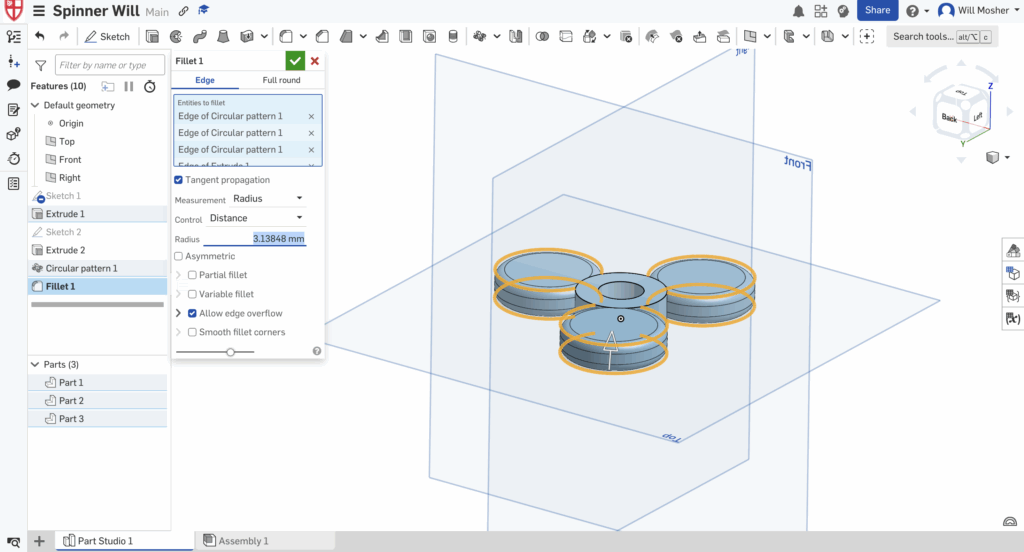
Now select the filet tool which rounds edges (Don’t mix it up with Chamfer) and drag the arrow until the edges are rounded enough. Now click the plus sign in the bottom left corner and create 2 new part studios. Right click on each of the art studios and rename them.
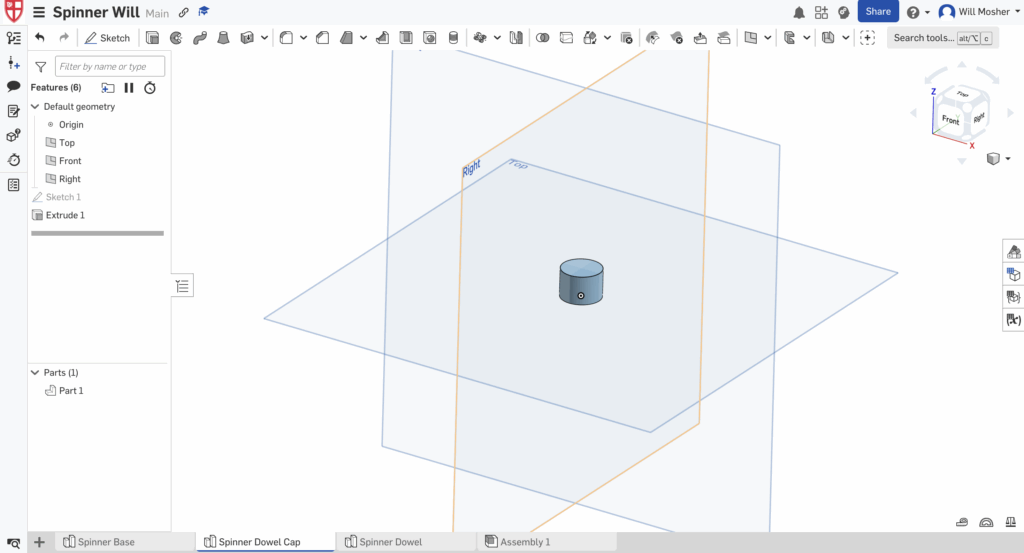
Now I’ll create the first part of the Dowel cap and Dowel part studio’s. Enter the dowel cap part studio then go back into sketch mode and create a circle with a 1mm smaller diameter than the diameter of the hole in the spinner base. Then extrude the circle and have the depth be identical to the spinner’s base.
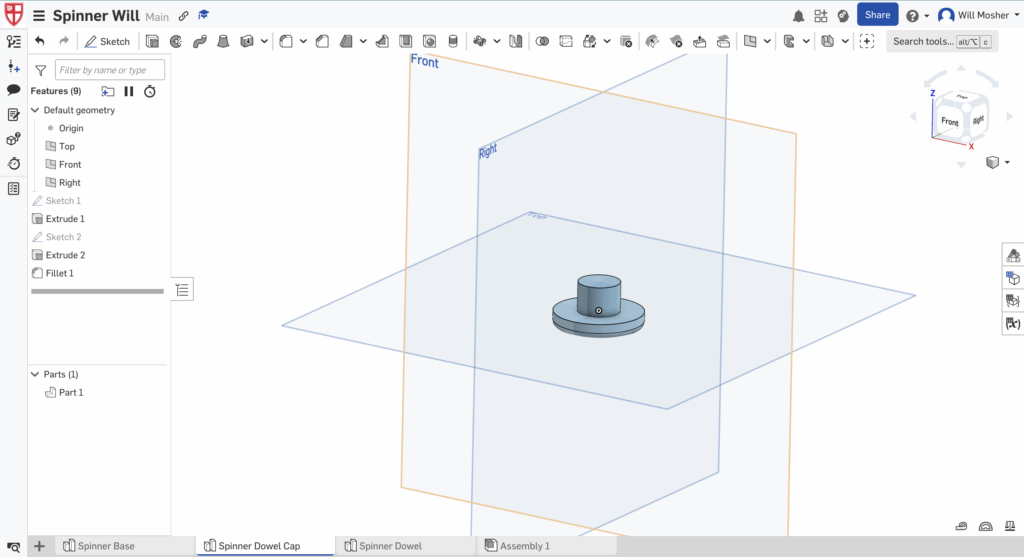
Now create another circle with the sketch tool, with the same diameter as the center circle of the spinners base. Make sure that the center point of the two circles in this part studio line up. Then use the extrude tool and make the new circle have a depth of 5mm before using the filet tool on the edges of the circle with a filet of 2 mm.
Now to finish of this part use the sketch tool to create a center point circle with the same center point as the other two circles. Make the circles diameter be 8mm and extrude then click remove and use it to hollow out the smaller cylinder.
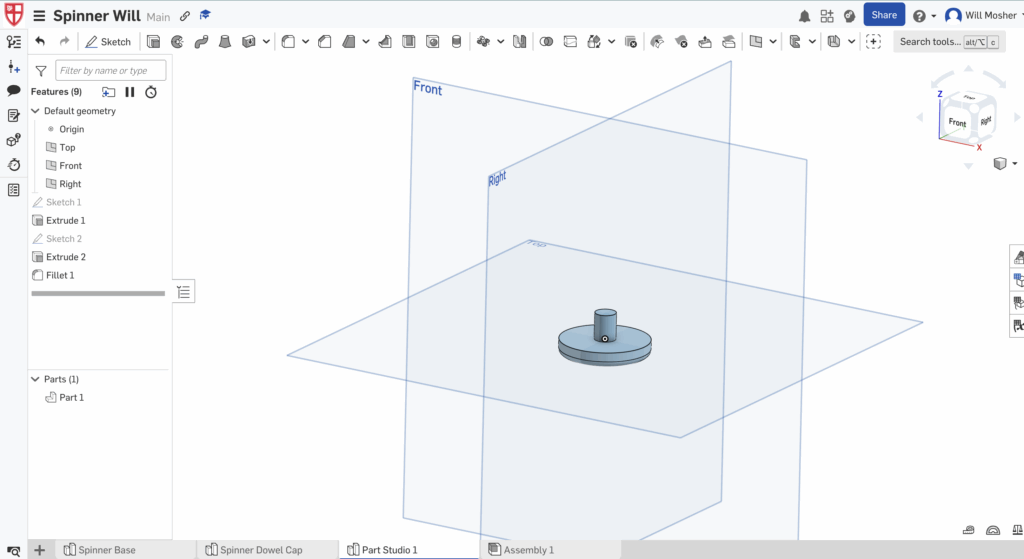
Lastly we need to create the other side of the dowel and cap so we’ll enter our other part studio. Then we will create a sketch of a circle with a diameter of 7mm and extrude in to 9mm. Then create another center point circle with the same center as the first one with a diameter of 30mm, extrude it by 5mm, and lastly use the filet tool to round the edges to 2mm. After this is done we must assemble the design in the assembly studio
Note below I switch to my actual final design because I remade it so I could show images for every step of the process. Also ignore the measurements above they are rough measurements so check my orthographic projection’s to find actual dimensions.
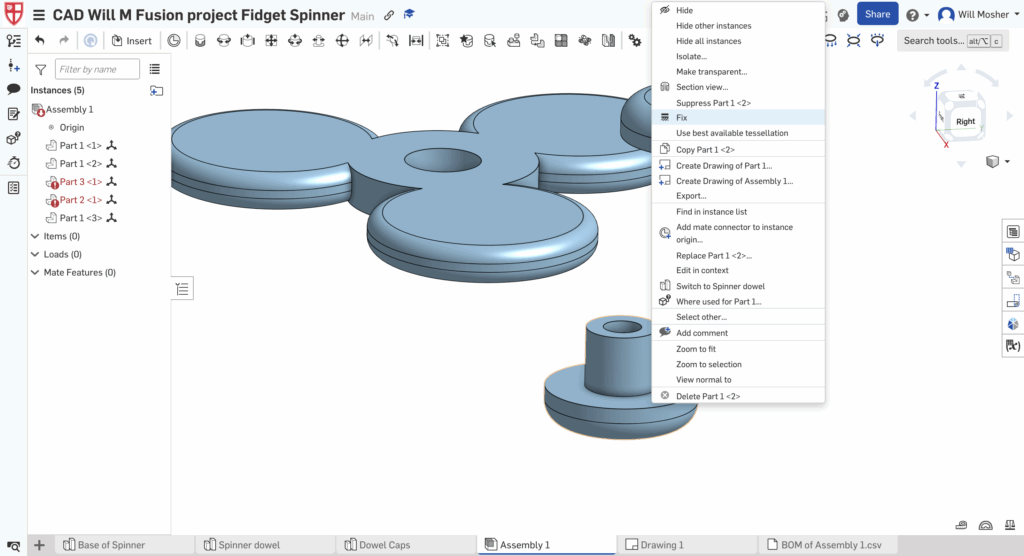
Lastly I must add my designs into the assembly page. To do this you must go to each part studio and select the entire model and copy it and paste it into the assembly. After this is I must use the fix tool which shows up after right clicking a piece to lock my spinner dowel cap in place.
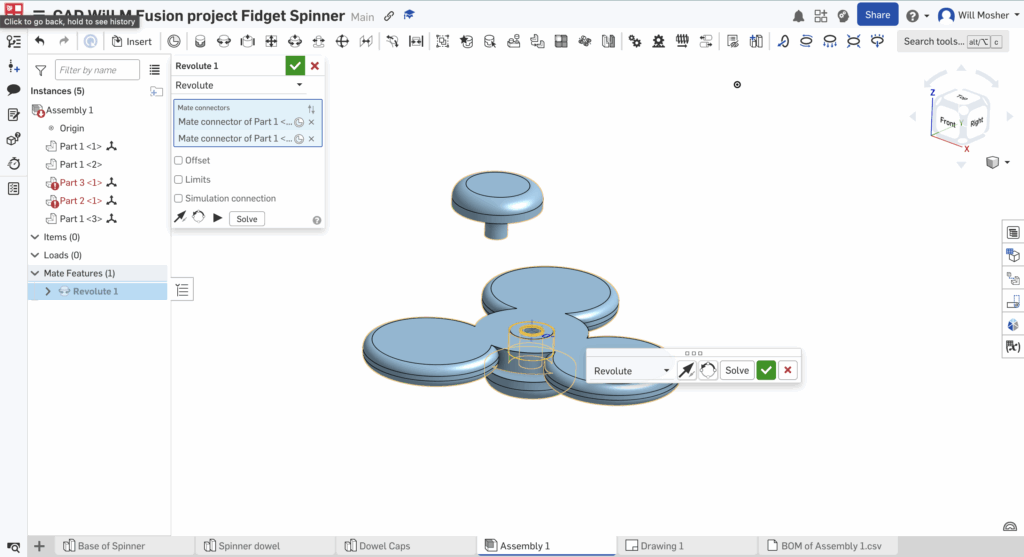
Next I will use the revolute mate tool which credit to https://www.youtube.com/watch?v=IwD4eg0kCGo on youtube for providing a great tutorial on how to use it. To use the revolving mate tool I must select it then left click the center of whatever hole or axis I want the object to rotate around. Then I need to left click the center of my object I want to rotate and this will create a revolving mate.
After creating this mate I can simply move my top dowel cap into place and right click then fix. Below is a video link showing the function of my design in onshape and an image of my final design in assembly.
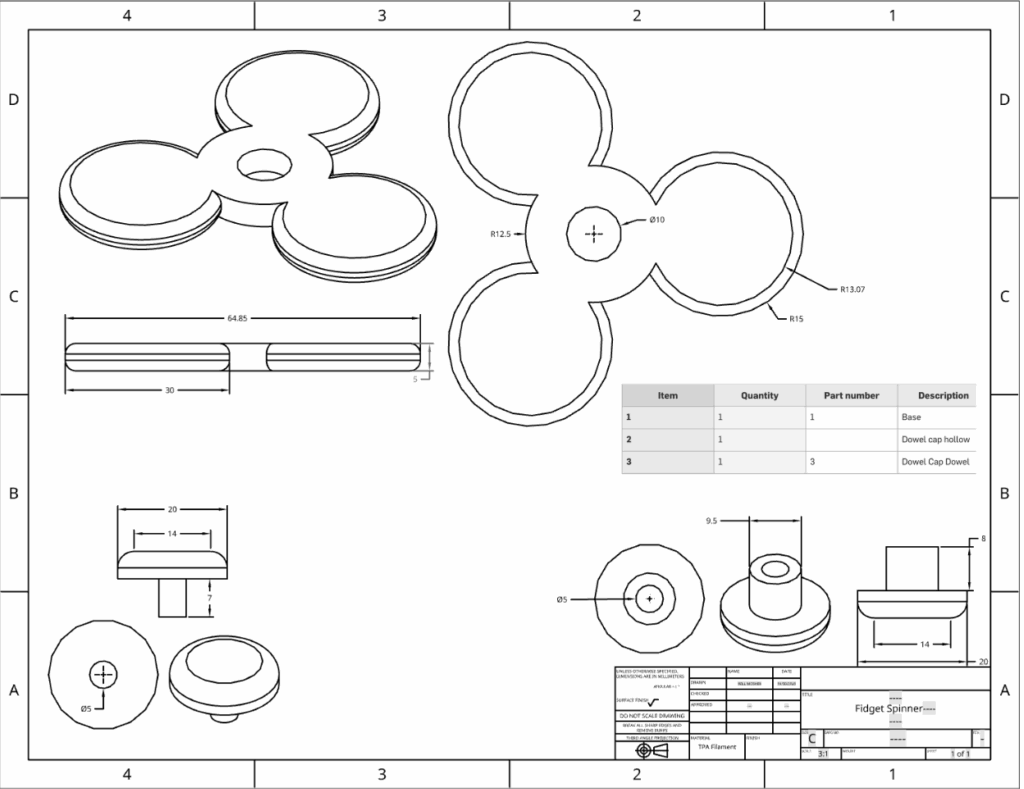
Lastly to finish this assignment I was tasked with making an orthographic projection of my design with all the dimensions so someone following the steps could recreate my design with ease. An orthographic projection is a way of drawing an image in which shows 3 dimensions in one, a front, a side, and a top. To make my orthographic projection I created a drawing layer and used the insert view to add in different views of my pieces. Then I used the dimensions tool to carefully mark all of the dimensions in my design. Lastly I went back to my assembly page and clicked on the BOM table button (Bill of materials) and created a table before I copied the table. And pasted it into my drawing layer.
After finishing this assignment I have learned many key and valuable skills about Onshape, being the circular pattern tool, creating a BOM table, and adding dimensions to my drawing page. In the future I would like to become more efficient with using the drawing pages and using the tools within that page.
Below is a transcript of my interactions with notebook LM when learning how to use the circular pattern tool.
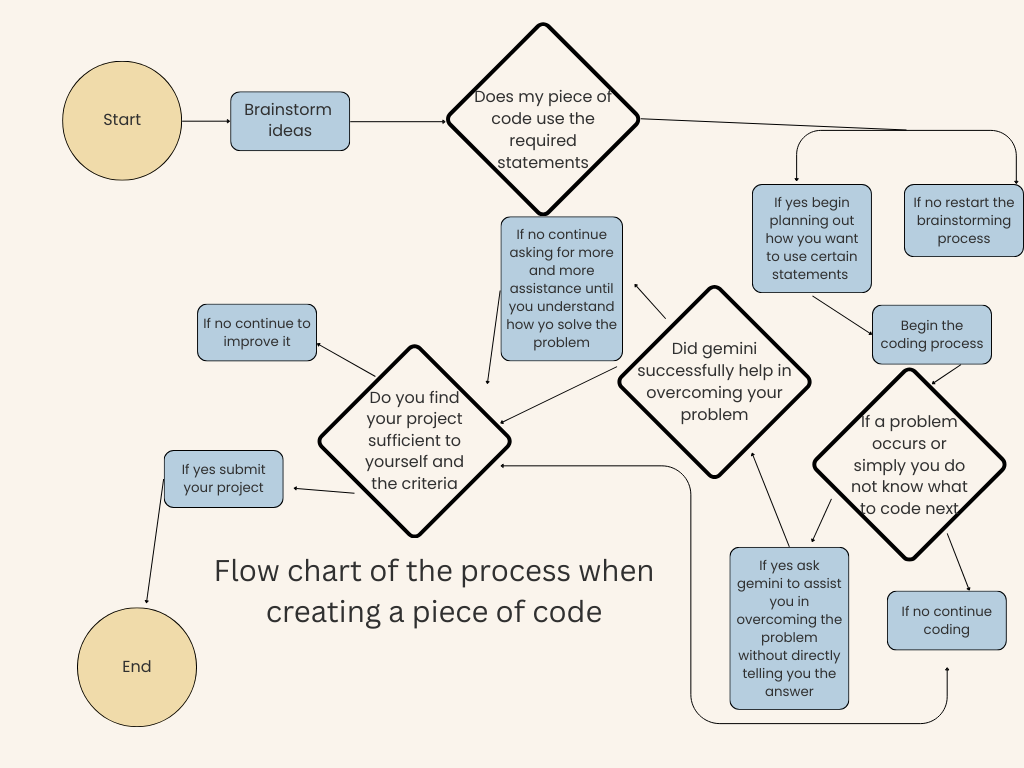
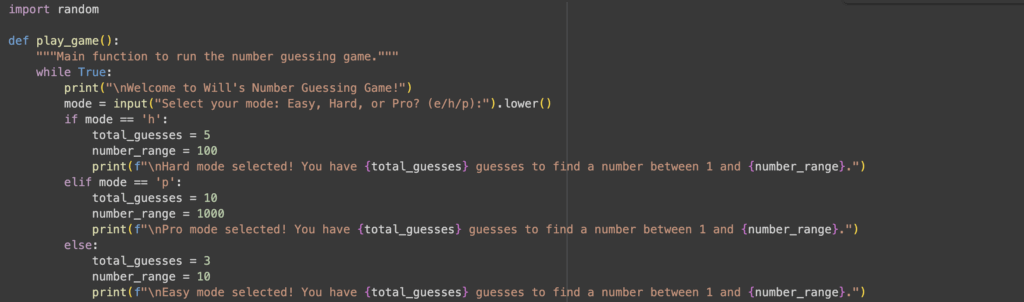
September 21st, 2025 Coding project #1 The Number game! During the past week I’ve been working on a piece of code with the goal of demonstrating a basic understanding and way to use simple coding statements. Throughout this process I’ve had success, failure, and road blocks but in the end produced a piece of code I’m proud of. I used assistance from google gemini in the creation of my project and a link to my chat in a google doc is just below. https://docs.google.com/document/d/1c7dUjtHHSlJs8PB8FRADFDpH2eKm8l9Qf-JZ_EcIUOI/edit?usp=sharing I chose to create a number guessing game in which the player would guess a number 1-10 and would be told whether the number was higher or lower than their guess. I executed my idea without any problems in which I found it quite amusing however for a source of entertainment it lacked complexity and became boring quick. I then added a guess counter, and a guess limit while keeping the thought of adding more ways to play in mind. I took the boldest move yet and made an attempt at creating multiple game modes. I first created a hard mode and added different winning lines and after learning it was quite simple I easily made a pro mode. In the end my code reflected a great use of the basic coding statements and accomplished its goal of being a fun entertaining game. I also created a flow chart to outline the process when tackling a coding problem. The image is below! Below is an in depth analysis of my code provided through this link https://colab.research.google.com/drive/1e2GC64BxgIyrPGTSjk7-cj3tSXUu_Agr?usp=sharing
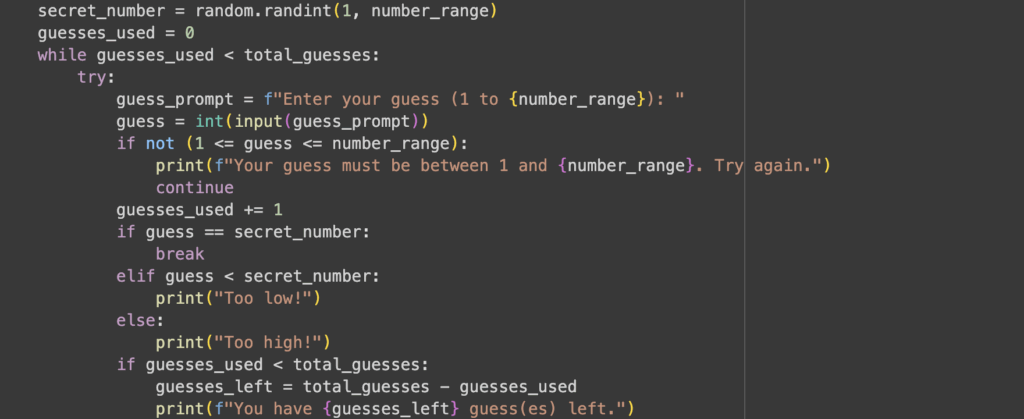
The first block of code goes over my number generation set being “import random”, printed text to open out the game, the ability to chose different modes that affect guesses and number ranges. While true allows us to create a loop for our code continuing to the end. The print line is a basic coding idea in which you type print and it projects text that you put inside the brackets. Below is an if statement and elif statement and an else statement which basically means if you type h run that code, if you type p run that code, and lastly if neither of the others it will run that code. The values below the if/else statements are the guess you get and the number range in which connect to the guessing portion of the code and the number range that is generated.
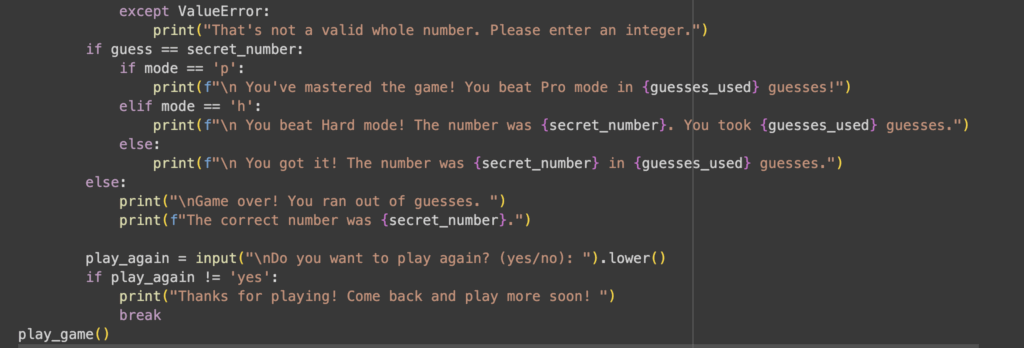
In this code block in includes the end of the first part showing the text that will be printed if mode = easy and also the higher or lower, and number generator. Line 2-4 work together to generator a random number between 1 and the number range of either 10, 100, or 1000 depending on your mode. line 5 goes over how if guesses used is less than total guesses the game will continue. The next few lines go over how the guess must = an integer for the request on later lines to be processed and that guess used goes up by one each time. Another if statement is used how if the guess equals the generated number than it will go down below and print the winning text but if it is not the secret number being lower or higher the respective texts will be written. Lastly if the guesses left are less than your total guesses than the request to print how many guesses you have left is run.
To start off the last portion of code it covers if not whole numbers and used as an answer, the winning lines for each respective role, losing lines, what the number was, and if you want to play again. If the value is not an error connecting to the previous line then line 2 in this section is printed. If the mode at the start was pro than an original line would be printed with the same for other modes. The else statement below shows that if the number is not guessed that 2 lines will be printed with the second listing the randomly generated number. Lastly an input is asked from the player for whether they want to play again and if the play again input equals yes the game restarts and if it doesn’t represented by the != sign than the text on the last line is printed before the play through ends.
Thank you for taking time out of your day to read my blog post on my coding project, don’t worry if your keen on reading More blog posts are coming soon!