A few months ago, my team and I wondered how hard it would be to land a rover on Ganymede. In this website I will show you how my team and I have built and tested a prototype for an extraterrestrial rover. Our team had to design an efficient transportation method on a foreign celestial body, both without wasting excess energy and without wasting time, capable of a 5-kilometre-long round trip on Ganymede, one of Jupiter’s moons. This vehicle must handle extreme conditions including temperatures as low as -180C, low gravity (a tenth of Earth’s), rocky terrain, and interference from the planet’s magnetic field affecting electronics.
Coming up with and designing the 3D prototype of our vehicle was the longest portion of the project. In the end, we decided on a 4 wheeled vehicle that looks similar to a car. We realized that if we were to build the complete rover, we would need to make the shelling out of a very heavy material so as to make sure it would not float away because of the small amount of gravity on Ganymede (The gravity on Ganymede is about 1/9th of Earth’s gravity!).
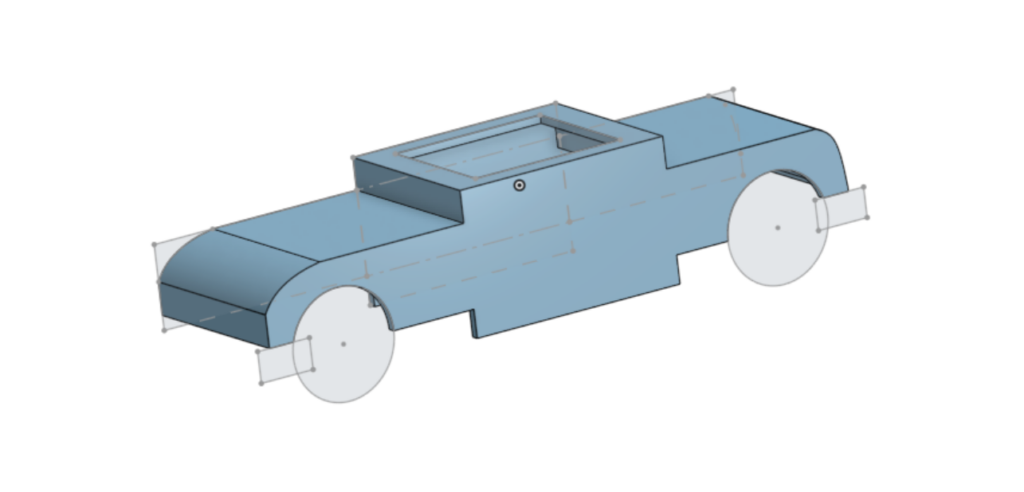
As shown above, the CAD portion of our design was quite blocky and later we ended up sanding it down so as to give the wheels some breathing room.
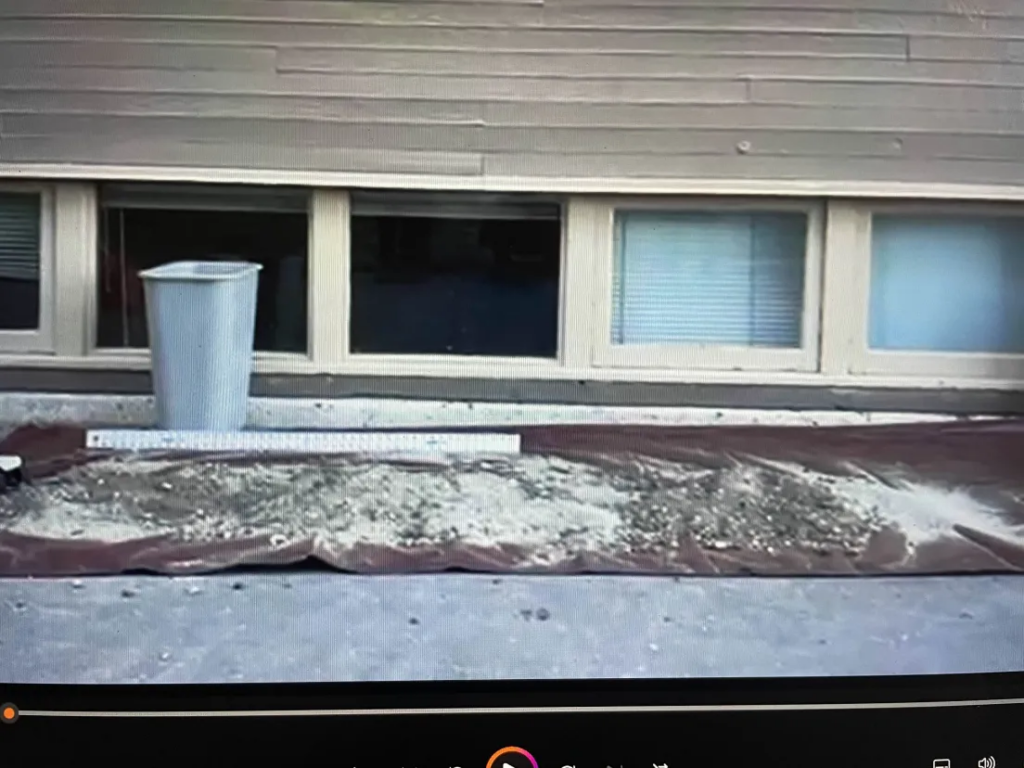
When testing, we used an app called “Vernier Video Analysis”. We used it to measure how fast our vehicle traveled on flat ground over a certain distance. We then tested how fast our vehicle traveled on rocky, sandy terrain so as to imitate the harsh climates of Ganymede. We created grooves in the sand with big craters and chunks of rock to simulate the grooved, chunky and crater filled portions of the surface of Ganymede in an attempt to make our tests more accurate. We created 3 different set ups of rocky terrains to test on which can be seen down below (apologies for low quality photos).
#1
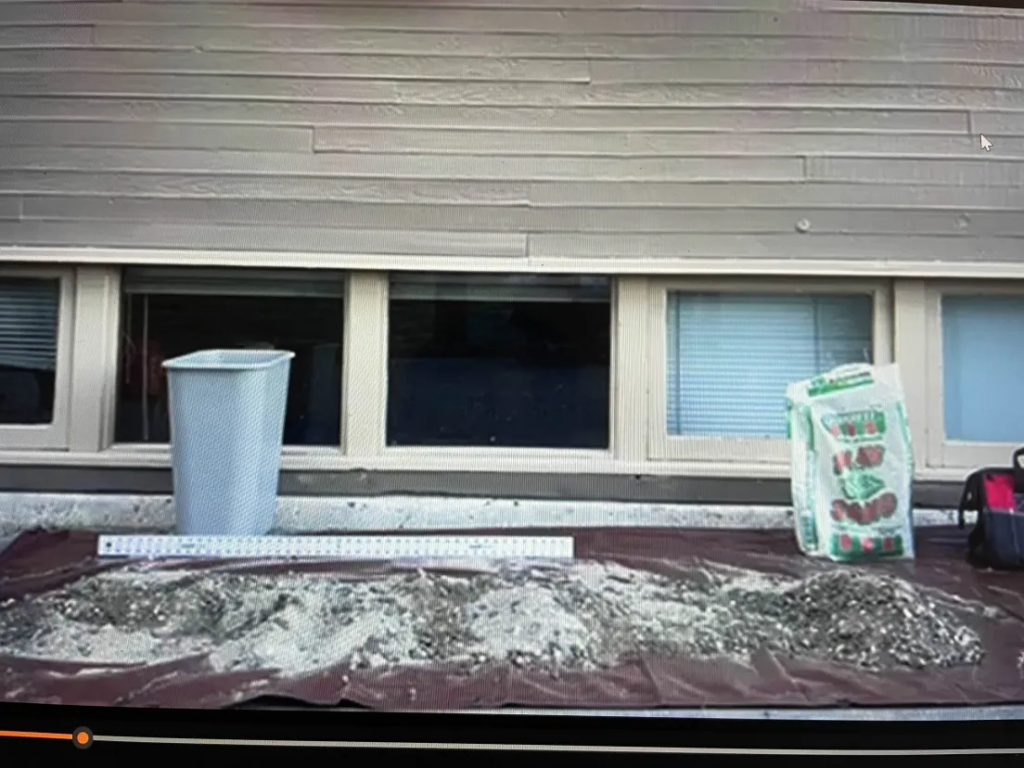
#2
#3
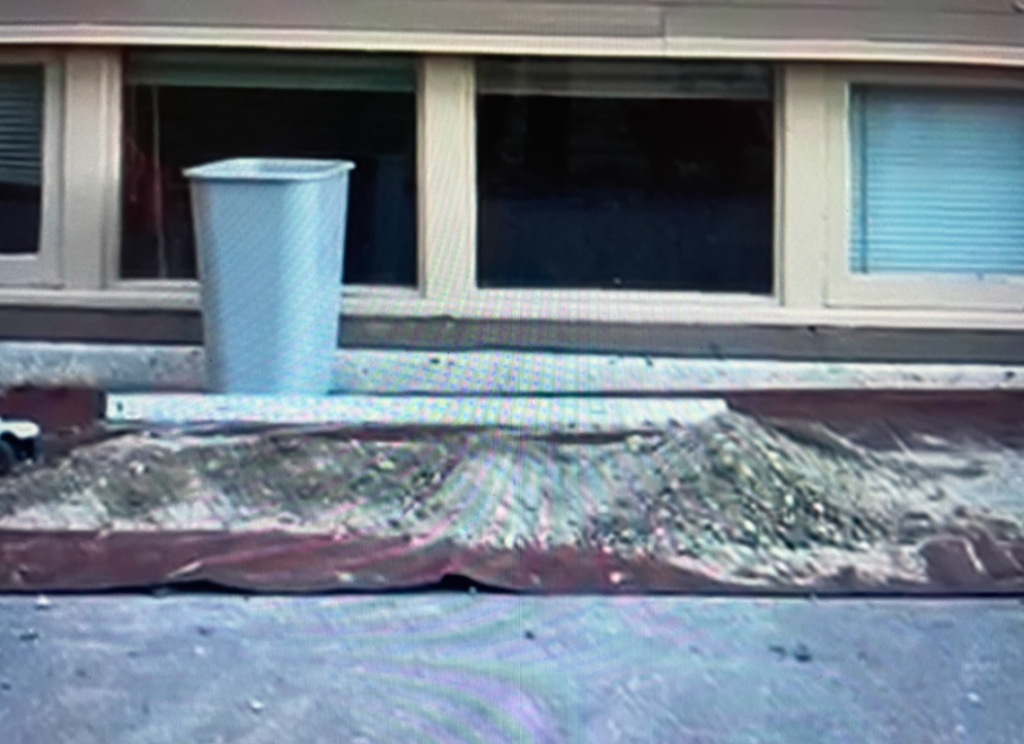
We tested on the first terrain 4 times, the second terrain with a smaller hill at the end once and the final terrain with the biggest hill 3 times. These will be referred to in the graph (along with the control) as Layout #1, #2 and #3 respectively.
The data that we collected is useful for allowing us to measure the amount of efficiency our vehicle has.
We took the average velocity per frame of the video on the grooved terrain and divided it by the average velocity per frame on the control (flat surface). This helped us calculate the amount of velocity it was able to maintain when on a rocky terrain to infer the speed it would have on the surface of Ganymede.
Efficiency is measured via input in over input out. By manipulating this equation, we found that the average velocity of the test over the average velocity of the control calculates the percentage of speed maintained by the car.
Along with this, we also created a graph to show the different averages amongst the different
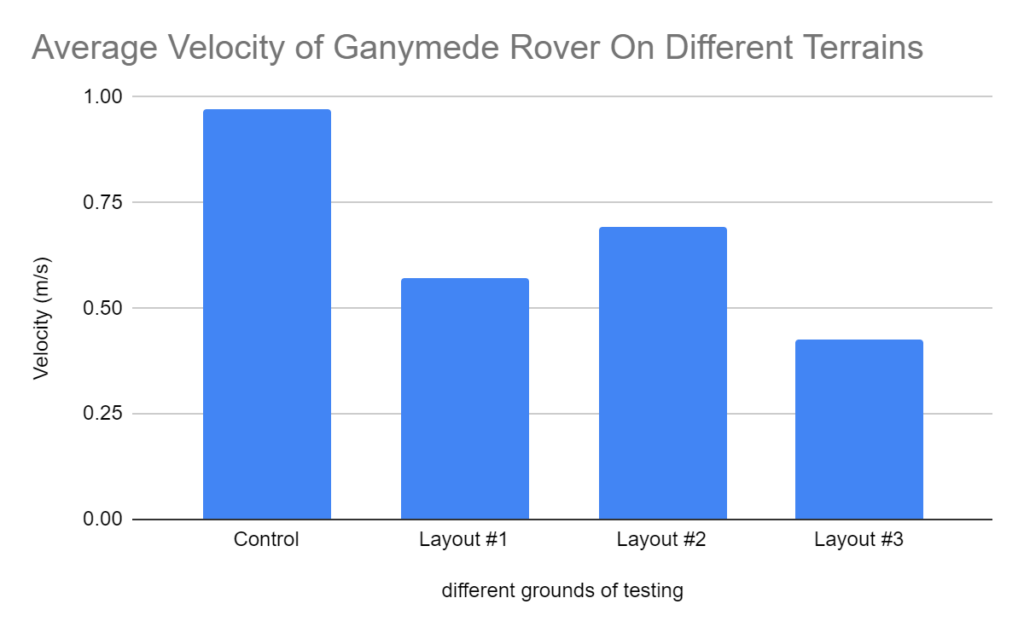
From this, we can find that the average of all three layouts comes to 0.5327 m/s, whereas the average of both of the controls comes to 0.9705 m/s. By manipulating the equation to the left of the text we get that the % of Loss on the test is 54.9%.
Based on what we learned from this test, there is a lot that we can improve. If we had the opportunity to create another prototype, I would turn the wheels that we had used into gears. This is because there was only one thing that the Rover was unable to do and that was climb a hill that was around 3 times its size. It was unable to do this because the squishy rubber wheels got stuck in the sand. If we had turned the squishy wheels that we thought gave it sort of an extra cushion and suspension into hard, gearlike wheels with many grooves for traction it could increase the rover’s climbing capabilities dramatically.
AI Transparency Statement:
Certainly! Here’s a message you can include in your essay to clarify the use of AI:
AI Transparency Note:
The only use of artificial intelligence (AI) in the creation of this essay was to generate this transparency statement. All other content, including research, analysis, and writing, was independently produced by the author without the assistance of AI tools. This note is included to ensure clarity and uphold academic integrity regarding the role of AI in this work.
Feel free to adjust the wording to better fit the tone or requirements of your essay!
Leave a Reply