In my first pitch, I introduced MotionX as a general purpose movement analysis tool, and the idea that anyone with a phone camera should be able to get expert-level biomechanical feedback without six-figure motion capture equipment. That core vision hasn’t changed, but my focus has sharpened.
I’m a rower. Rowing is a sport where millimeters and milliseconds matter, and would be a sport that needs this tool more urgently. A rowing coach stands on the shore watching four or eight athletes cycle through strokes at 30+ per minute. By the time practice is over, most of what happened is gone from memory. Coaches film practice sessions. After practice, they review video by pausing, and rewinding at body positions, trying to turn a blurry mental picture into concrete feedback. It takes hours and the results are still subjective.
Right now, the feedback loop between “what happened on the water” and “what to fix” is almost entirely manual. A coach might pause a video, eyeball the catch angle, and say “your knees look too compressed.” But is it 5 degrees off or 20? Is it getting worse over the session? Is one athlete dragging the crew’s timing off?
Even that 5 degrees at the catch determines whether you’re compressing efficiently or loading your lower back. Multiply that across 200 strokes, across an entire crew, and small errors compound into injury risk and lost speed that nobody can see in real time.
Updated definition statement: Build a web-based tool that takes a single rowing video as input, automatically identifies each athlete, tracks their body positions frame-by-frame, detects the key phases of each stroke (catch, drive, finish, recovery), scores their technique against reference standards, and presents the results in a way that a coach can immediately act on. This is done all without requiring any special hardware beyond a phone camera.
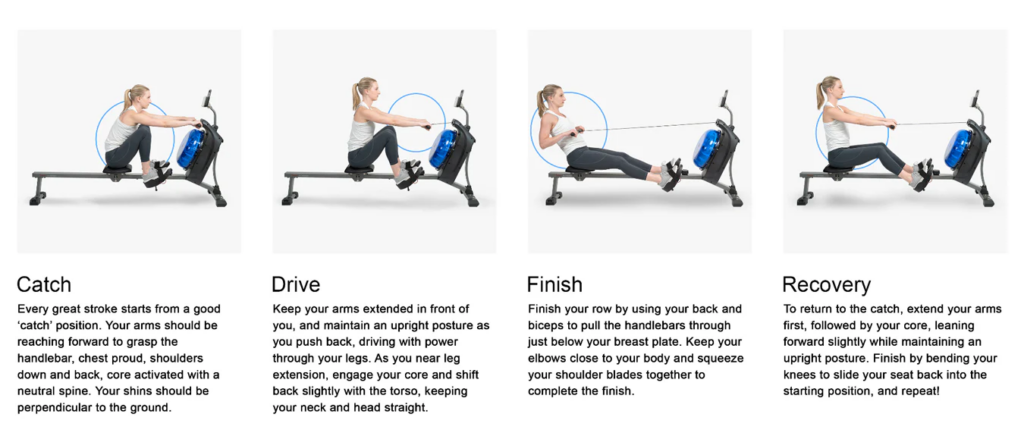
Image showing all the body positions in a rowing stoke
The underlying pose estimation and scoring algorithms are sport-agnostic, meaning the same platform can expand to analyze basketball shooting form, physical therapy exercises, weightlifting technique, or any repetitive human movement with the right reference recordings. Therefore the project expands as it is not limited to one single sport. Based on my current prototype, I would say that it is more polished for sports like rowing. But it can definitely be applied for other sports after a bit of refinement.
The primary users are rowing coaches and athletes at the club and collegiate level. The secondary audience is anyone involved in repetitive full-body motion who could benefit from automated technique analysis (physical therapists, CrossFit coaches, etc.).
Here are a few technologies and background research conducted to help build and support for the foundation of the project.
MediaPipe -> Yolov8-Pose Worth to mention, I have shifted one of the core technologies from MediaPipe to YoloV8. These libraries are used for pose estimation and identifying landmarks on the body. Previously, I have worked with Google’s MediaPipe, which tracks 33 keypoints on a single person. However, rowing is a team sport, and a typical training video has 4 athletes in frame. I have explored possible solutions by first using a library that identifies all humans in a video and crops them then sending it to MediaPipe to analyze them each individually. However, that might demand more memory and take longer to analyze. After evaluating alternatives, I switched to YOLOv8-pose, which natively supports multi-person detection with 17 keypoints. Those 17 points (shoulders, elbows, wrists, hips, knees, ankles) capture exactly what matters for rowing biomechanics, without the noise of MediaPipe’s 33 points (which include individual fingers and facial landmarks that are irrelevant here).
The market need is real. Over 15 million physically active Canadians, a 287 billion global rehabilitation market, and a complete absence of accessible multi−person movement analysis tools. Professional systems(Vicon,Qualisys)cost 150,000+. Consumer apps count reps. Nothing in between does what this project does.
In terms of deliverables, I am building a web based application with a fully functional backend and frontend.
Backend (Python/FastAPI):
Video upload: YOLOv8-pose processes every frame, detecting all athletes and extracting 17 keypoint positions per person per frame
8 joint angles calculated per athlete (left/right shoulders, elbows, hips, knees) using arctan2 on 2D coordinates
Stroke phases detected per athlete using knee angle signal analysis
Technique scored via DTW comparison against reference standards
Annotated video generated with per-athlete color-coded skeleton overlays
AI coaching reports via an AI API, fed with actual biomechanical data
All heavy processing runs in background workers (Celery + Redis) so the user isn’t waiting on a frozen screen
Frontend (React/TypeScript):
Upload page with configuration (crew type, model quality, frame skip rate)
Real-time progress bar while analysis runs
Results dashboard with: video player (toggle between original and skeleton overlay), per-rower score breakdowns, radar charts, stroke rate timelines, angle statistics, and a Key Frame Viewer that shows the exact catch and finish positions for every stroke
AI coaching page with report generation and interactive chat
Standards library for uploading reference videos to score against
How I’ll test it against the definition statement: The core question is whether a coach can watch a practice, upload the video, and get actionable feedback faster than they could by manually reviewing the footage. I plan to test this with actual rowing coaches: have them review the same video manually, then compare their notes to the system’s output. If the system identifies the same issues (and finds additional ones the coach missed), the definition is met.
Progress So Far
According to my timeline, I’m at the end of Research & Planning and transitioning into active development. Here’s what’s actually built and working:
Sorry for the crappy screenshot, my laptop screen broke when writing this blog, I wasn’t able to have direct access to my code
Complete and functional:
Full video upload, multi-person pose analysis, results pipeline, tested with real 4-rower crew footage
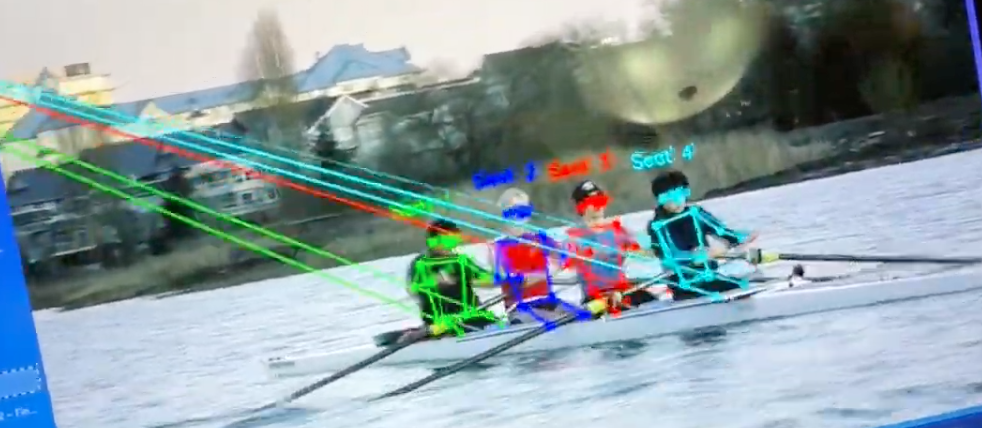
This is an interesting demo video of the prototype. Unfortunately, the sound wasn’t working. I was showcasing the backend of the current prototype, which is running in my terminal with a docker environment set up. The backend is mainly in charge of processing requests to access database and to process the analysis pipeline in the background. I have uploaded a video of a crew rowing, and it is able to successfully track the four people moving in the boat. The page currently also provides a general analysis of the body movement for each individual athlete.
In the development process, there are definitely several challenges that I will face.
In certain frames, the program looses track of the people and couldn’t recognize them. Most of the time, this is due to the clarity of the video or the video being shot too far away. Other factors like lighting definitely also plays a role in causing this issue.
Performance wise, the analysis process is currently ran on my laptop locally. The process is taking a bit longer than I expected (2-3 minutes). I have asked an AI, and if I deploy the backend onto a sever it should speed up the processing speed to under a minute.
I am planning on adding an AI feature. And I would have to find a way to send all the motion tracking data to the AI, whether that’s through forming all the data in JSON form or giving the AI specific instructions to process this information.
In the upcoming weeks, I see myself working through the online motion analysis phase as this is my #1 priority. By making sure all the core functions work: making sure the accuracy of the analysis, specifically for rowing videos. Also asking coaches what they would be hoping to get from the analysis. After that, I would be able to then move on to polishing the entire system. Adding user system, AI integration, and polishing the UI/UX/ overall experience.
I am happy with my progress so far and is excited to continue working on this project after the break. Hoping to deliver it to a wider audience in the near future.
As a high school rowing athlete, I know that precise body movement is crucial in sports. In rowing, the catch angle of your arms, the drive through your legs, the sequencing of your hip hinge, and if any of these are even slightly off, you’re not just losing speed, you’re risking real injury. Overuse injuries from repeated improper form are incredibly common in sports, and the frustrating part is that most of these are preventable if you could actually see what your body is doing wrong.
But here’s the thing: it’s hard to quantify those movement errors into numbers. The human eye can’t detect a 5-degree difference in knee angle, but that 5 degrees might be the difference between staying health and getting injured.
Definition Statement
Current methods for analyzing human movement quality are either prohibitively expensive (professional motion capture systems like Vicon cost $150,000+) or too limited (consumer wearables only track basic metrics like steps and heart rate). This leaves everyday athletes, rehabilitation patients, and fitness enthusiasts without accessible tools to evaluate whether their movement form is biomechanically correct. The goal is to develop an affordable, AI-powered system that can perform full-body biomechanical motion analysis using only a standard camera, delivering expert-level feedback that was previously only available in clinical laboratories.
Who Am I Solving This For?
One of the most exciting things about this project is that the technology isn’t limited to one sport. The pose estimation tracks general human movement, and the scoring algorithm compares any two motion sequences. That means with the right reference recordings, the system can analyze a basketball free throw, a yoga pose, a deadlift, or a physical therapy exercise with the same accuracy.
There are over 15 million physically active Canadians and the global rehabilitation market is $287 billion, showing that the demand for accessible, accurate movement guidance is massive, but the supply is locked behind six-figure price tags or oversimplified apps that just count your reps.
My Solution: MotionX
My idea is to build an AI-powered movement analysis system called MotionX that uses a standard phone camera to perform real-time, full-body biomechanical analysis. Without using any markers, special hardware, expensive subscriptions. The system would:
Capture and track skeletal movement using MediaPipe’s pose estimation
Compare the user’s movement against a standard reference video using a DTW-based temporal comparison algorithm that handles natural speed variations
Score movement quality on a 0–100 scale with specific per-joint feedback
Provide AI-powered coaching through a language model that translates raw biomechanical data into plain language guidance and personalized training plans
The key technical differentiator is Dynamic Time Warping (DTW) — it doesn’t just check if you’re in the right position at one moment, it compares your entire movement trajectory over time against a professional reference, naturally handling the fact that you might move faster or slower. No consumer app currently does this.
I have previously worked on this idea a bit and developed a science fair version of MotionX that proved the concept works. But right now it’s a collection of individual parts: a Python desktop app, local video processing, API calls stitched together with scripts. It’s a prototype, not a product.
My main goal for this course is to take everything I’ve built and merge it into a single, polished, user-ready web application. That means building a real user system with account registration and login so people can track their progress over time. It means moving the motion analysis from a local Python script to an online platform where someone can upload or record video directly in their browser. It means setting up the AI coaching API properly. And it means designing an interface that anyone can pick up and use without reading documentation or understanding what DTW stands for.
What the Prototype Will Look Like
For testing and display by May, my prototype will be a functional web application with these core features:
A webcam-based pose capture page that overlays the detected skeleton on the live video feed in real time
A comparison engine that lets you record a movement, select a reference, and receive a DTW-based similarity score (0–100)
A results dashboard showing per-joint angle comparisons (bar chart), an overall score, and specific correction suggestions
AI-generated coaching feedback translating raw biomechanical data into actionable, plain-language advice
Step-by-Step Plan
Phase
Tasks
Deadline
Research & Planning
Finalize tech stack (React, Flask/Node, database), design system architecture, plan user flows and wireframes
Week 1
User System
Build account registration and login, set up secure database for user profiles, implement session management and password hashing
Week 2
Online Motion Analysis
Integrate MediaPipe pose estimation to run in-browser or via server, build video upload and recording interface, integrate DTW scoring pipeline with the web backend
Week 6
AI Coaching Integration
Set up AI API and connect three coaching agents (Professional Analysis, Training Plan, Expert Coach) to user-facing dashboard
Week 8
UI/UX Polish
Design clean, easy-to-use interface, add progress tracking and session history, build results dashboard with charts and joint-by-joint breakdowns
Week 10
Testing & Launch
User testing with real athletes and families, fix bugs, optimize performance, deploy and document
Week 12
Possible Problems
Lighting and environment: Poor lighting can throw off pose detection. I’ll design a “setup check” screen to help users optimize their environment.
Single-camera depth estimation: Estimating 3D positions from a 2D camera is inherently an approximation. Multi-camera setups would help but defeat the accessibility goal.
Reference quality: The system is only as good as its reference movements. I’ll need to create high-quality reference standards, ideally from coaches or sports science resources.
Browser performance: Running real-time pose detection in a browser may struggle on older hardware. I’ll need to test across devices and potentially offer a “lite” mode.
DTW sensitivity plateau: Based on my research, Z-score normalization creates a scoring plateau at extreme deviations, and scores flatten around 89–90 even for very poor form. This is a known tradeoff that improves robustness but limits the scoring range.
Despite these challenges, the core technical feasibility has already been demonstrated in academic research. The opportunity is in the integration. Fusing pose estimation, temporal comparison, and AI coaching into a single accessible tool that nobody has built yet.
For the past several weeks, our group has been working on designing and building a vehicle capable of operating on Callisto, Jupiter’s second-largest moon. In the first blog post, we explored what makes Callisto a compelling destination: its position outside Jupiter’s deadly radiation belts, its stable and ancient terrain, and the possibility of a salty subsurface ocean hidden beneath kilometers of ice. But knowing about a place and actually building something that can work there are two very different challenges.
Our definition statement for this project was:
The vehicle must be capable of operating independently on Callisto, a remote, frozen, and airless moon with extreme cold (approximately −139°C to −190°C), low gravity (0.126 g), and weak sunlight (roughly 4% of Earth’s). It must generate its own power without relying on solar energy, maintain safe interior temperatures for its crew and components, and reliably traverse rocky, ice-covered terrain over a 5 km round-trip distance.
The purpose of our prototype and testing was to validate one of the most critical aspects of this design: whether a tracked vehicle can efficiently navigate rough, uneven terrain similar to what we’d expect on Callisto’s surface. We weren’t able to simulate every condition (vacuum, extreme cold, low gravity), but we focused on the mechanical challenge of traveling on rocky terrains and energy efficiency, which are directly tied to whether this vehicle concept is viable.
This post walks through our final design, the process of building and testing our prototype, the data we collected, and what it all means for our vehicle’s real-world performance on Callisto.
(You can view the initial research and planning in PEP Assignment 1.)
Method / Procedure
Design Evolution
Our vehicle went through several design iterations before we settled on the final concept. Early brainstorming included ideas like wheeled rovers, legged walkers, and even hopping vehicles. However, given Callisto’s combination of low gravity, rough cratered terrain, and icy surfaces, we kept coming back to a tracked (tank-tread) design as the most practical option.
The key reasoning was:
Treads distribute weight over a larger surface area, which provides better traction on loose or icy ground compared to wheels
Treads handle uneven terrain more reliably, climbing over small obstacles and crater rims without getting stuck
The low center of gravity helps with stability, especially important given Callisto’s low gravity where a tall vehicle could easily tip
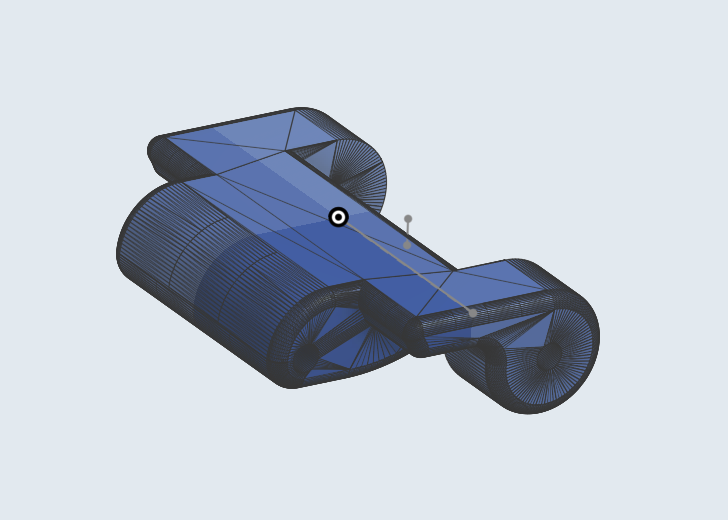
We then settled on a design with two independent track assemblies, each with one motor driving the tread.
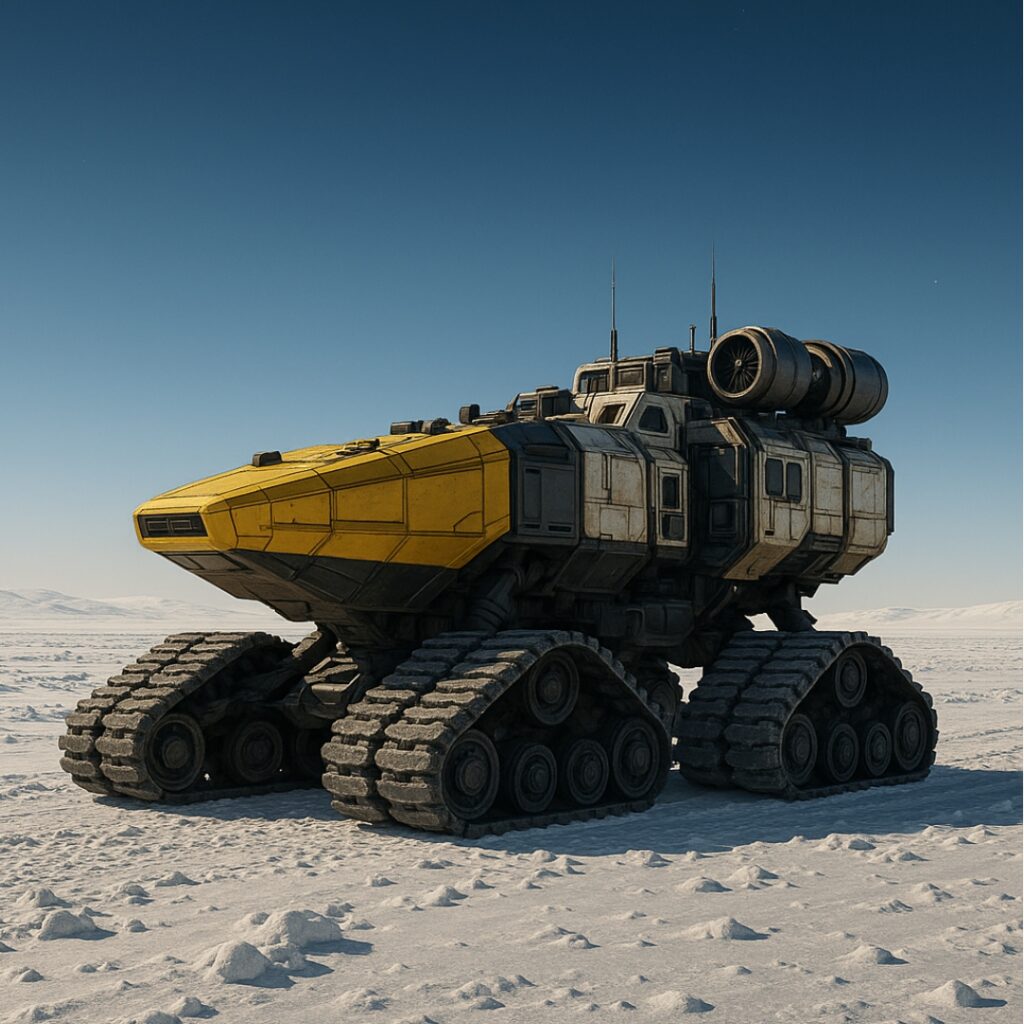
Concept Design made by AI
CAD Design
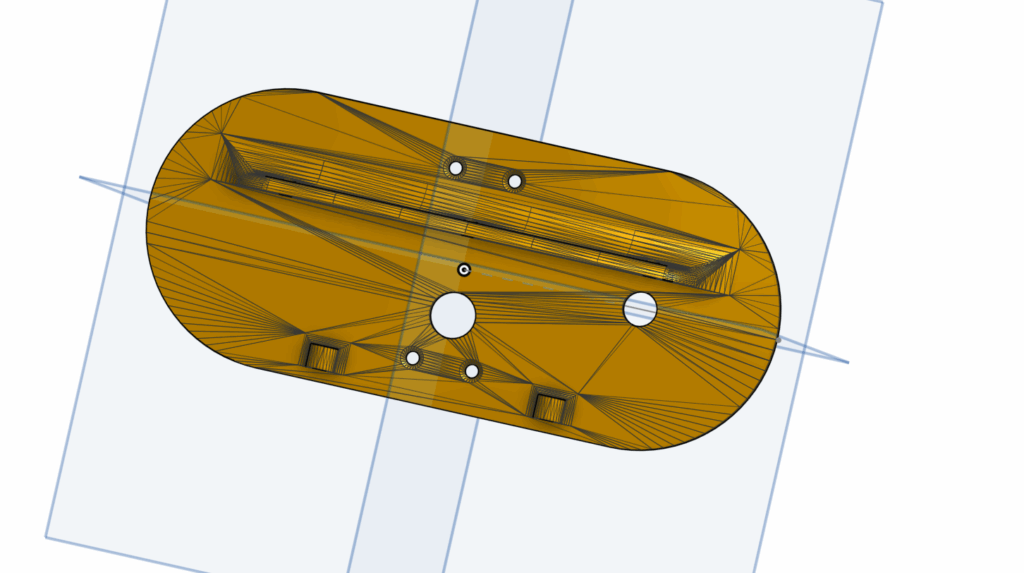
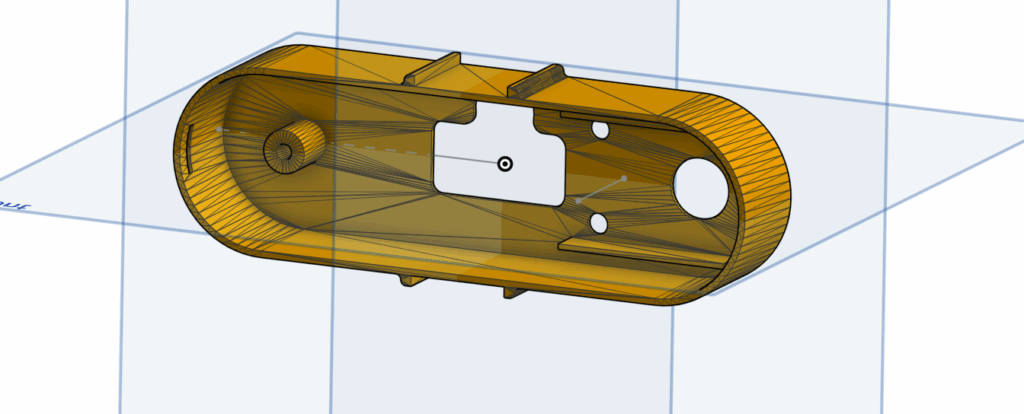
We built the full 3D model in OnShape. This includes, a chassis (though we later decided to switch to wood boards using laser cutting), track, gear, and holder. The chassis was designed with a hollow interior to hold electronics (battery, motor, and wiring), and the front of the vehicle was shaped to deflect debris and provide a lower approach angle for climbing obstacles.
Key design decisions in CAD:
The chassis shell was designed to be 3D printable as a single piece that fits over the drive platform
We included mounting points for the track assemblies on both sides
The interior was kept hollow and accessible for wiring and battery placement
The front profile was angled to help the vehicle climb over obstacles rather than collide with them
Track design that can be connected with each other to form a complete chain using metal rod
Inner and outer cases for the track component
Motor mount used to secure the motors
Bill of Materials
Component
Quantity
Purpose
PLA Filament
As needed
3D printed parts for track components
Chassis
1
Base drive platform
Tank Tread
22
Terrain traversal system
Axis
22 pieces
Connects treads
Battery Pack
1
Power source
Motor
2
Speed and direction control
Jumper Wires
As needed
Electrical connections
Screws & Nuts
As needed
Securing removable components
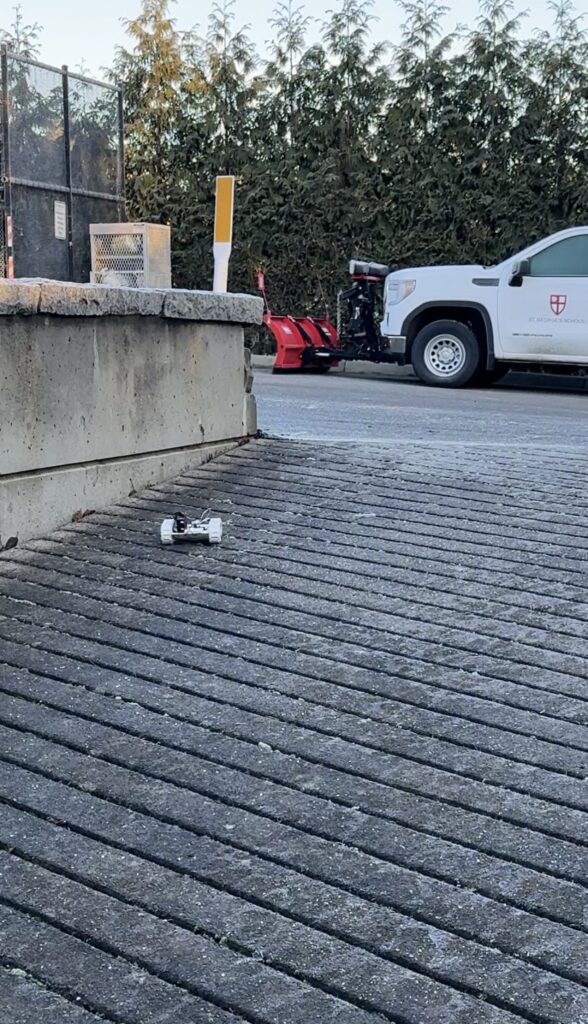
Prototype Build Process
Phase 1: Chassis Fabrication
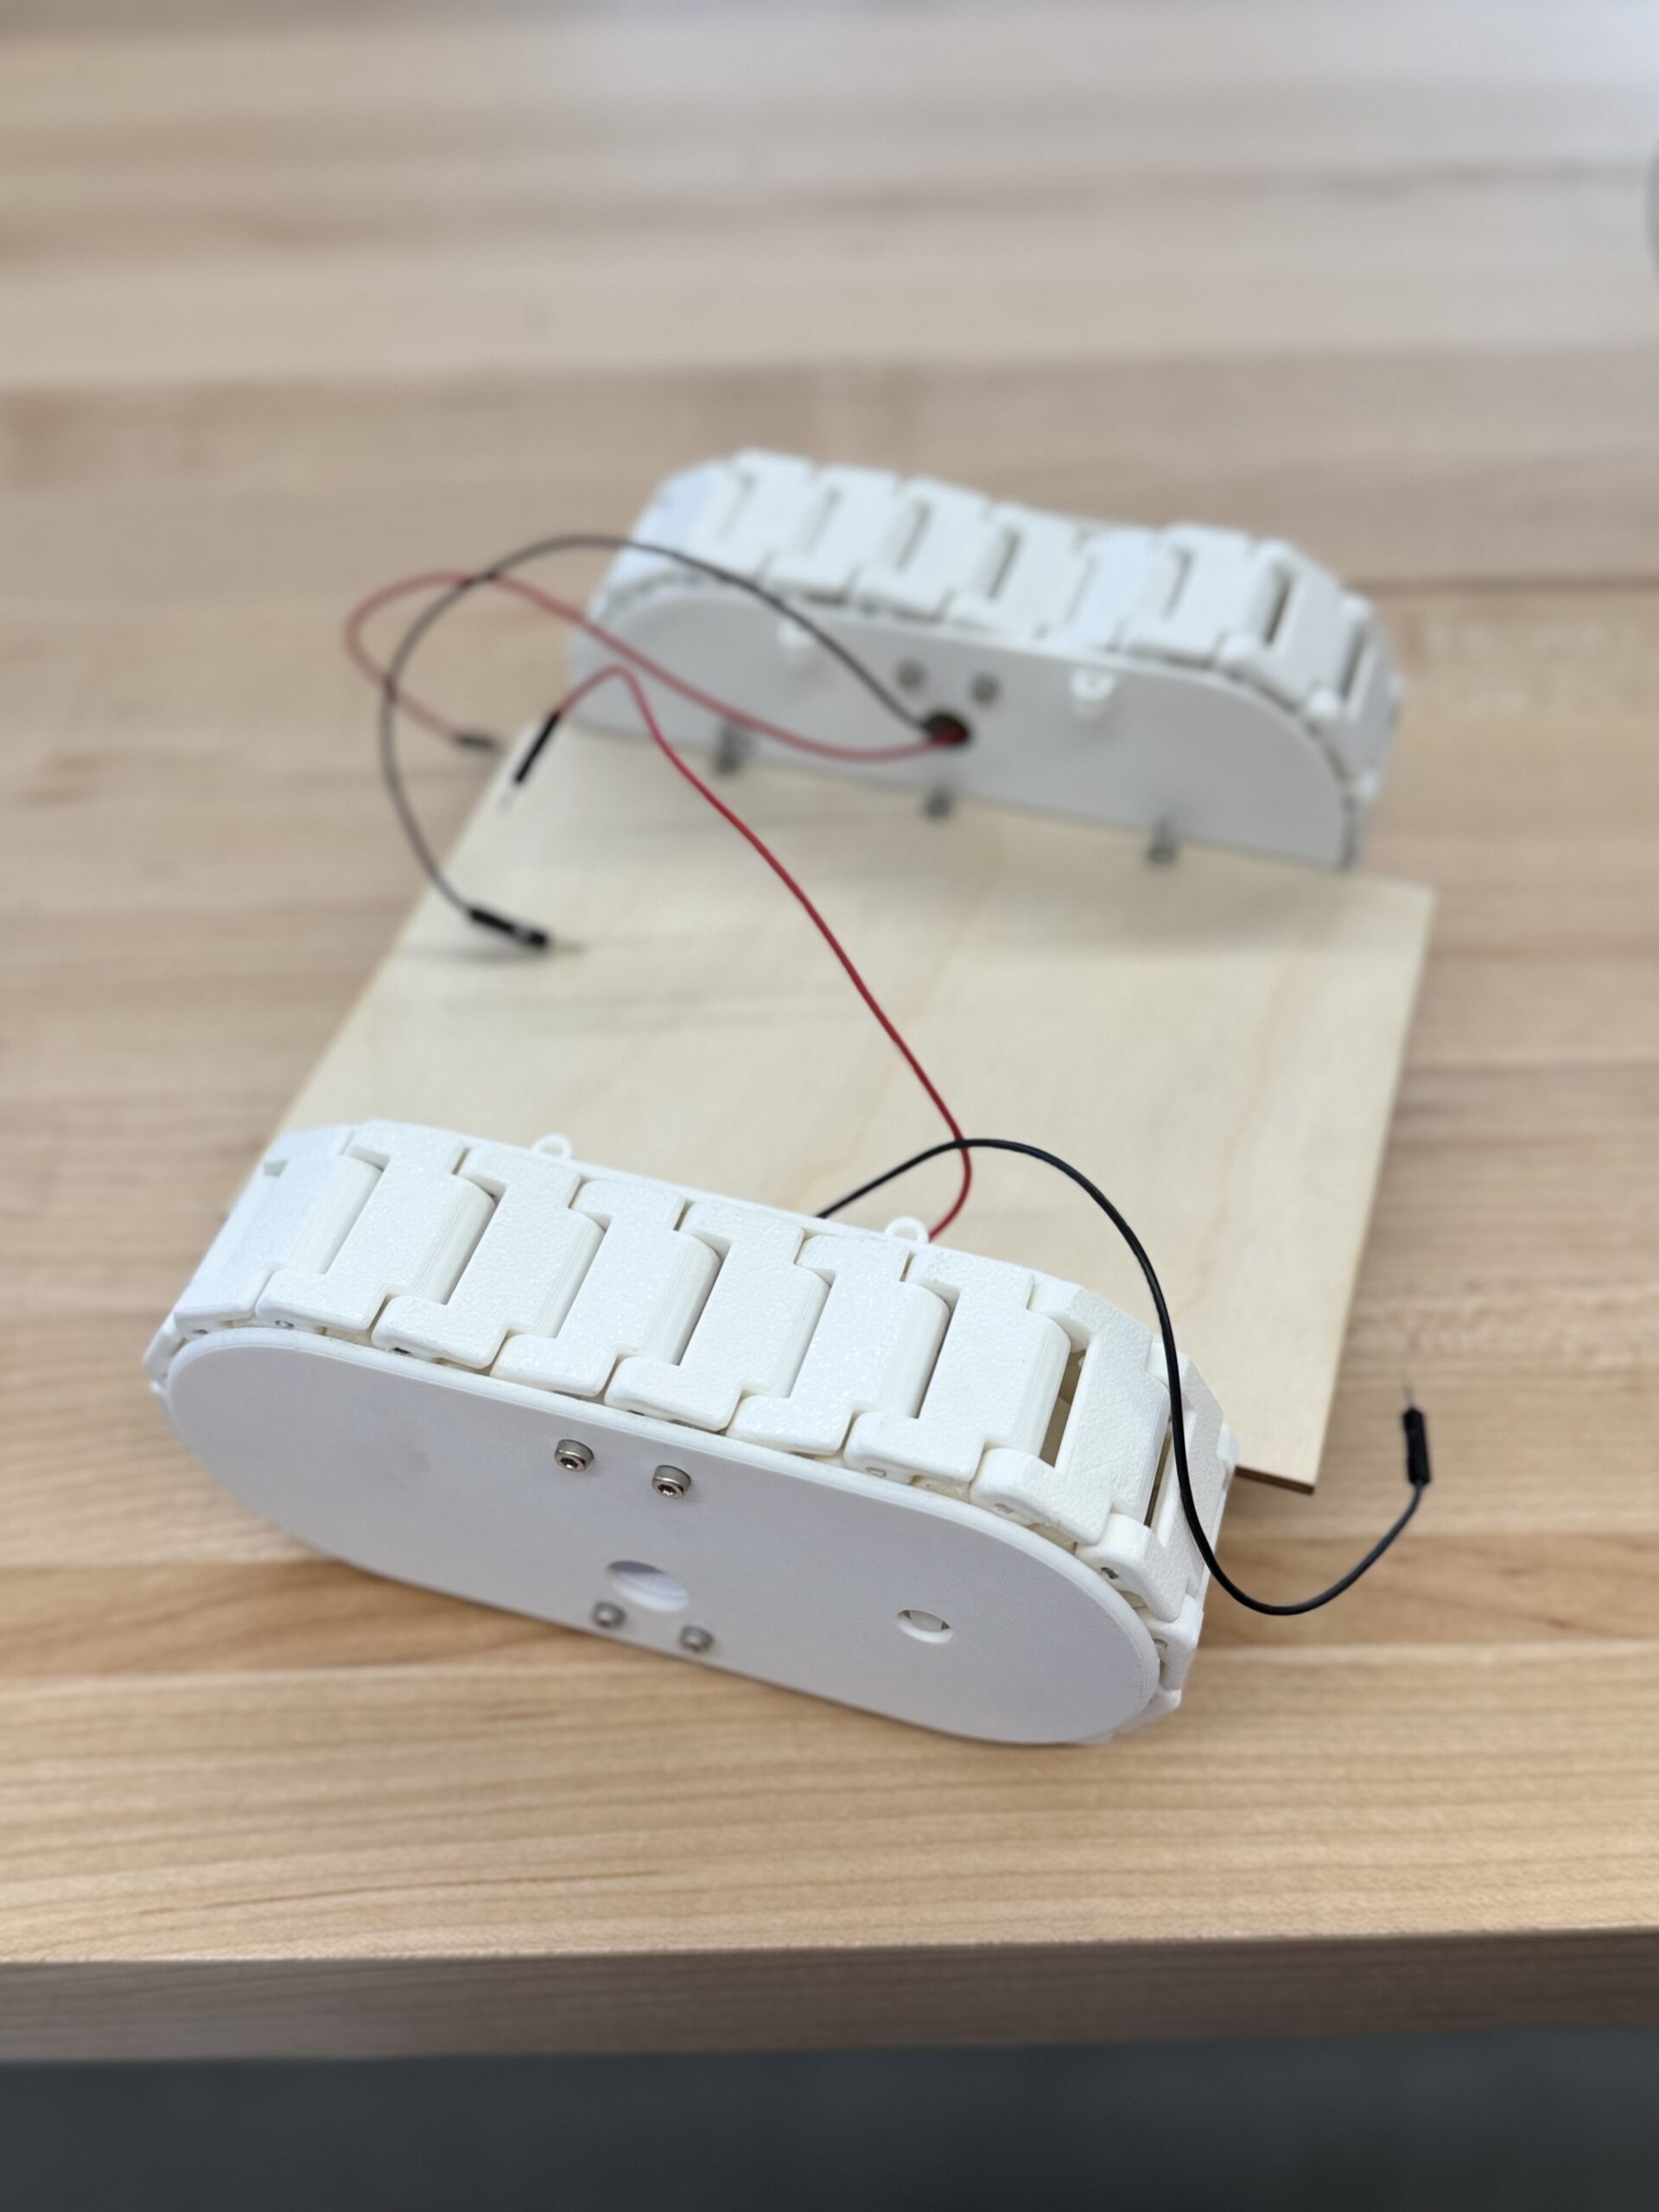
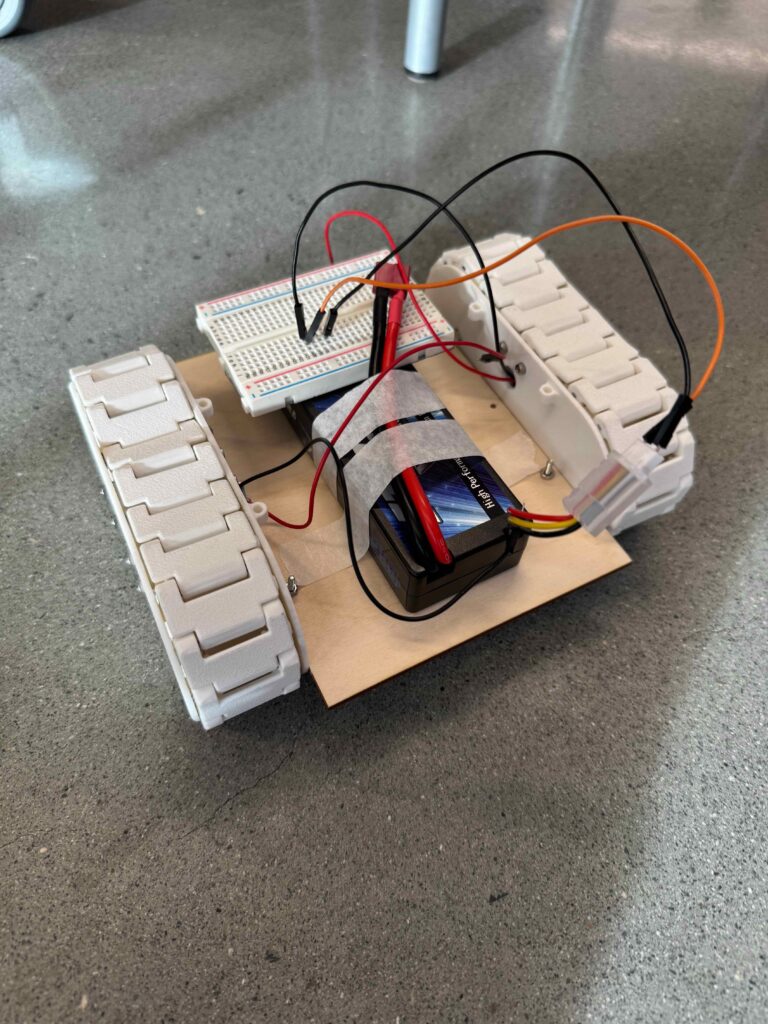
We were planning to 3D print the chassis using PLA filament. But after further discussion around material use, weight, and size, we have decided to use wood instead. We have laser cutted the wood board and mounted all the components on directly using screws.
Phase 2: Track Assembly
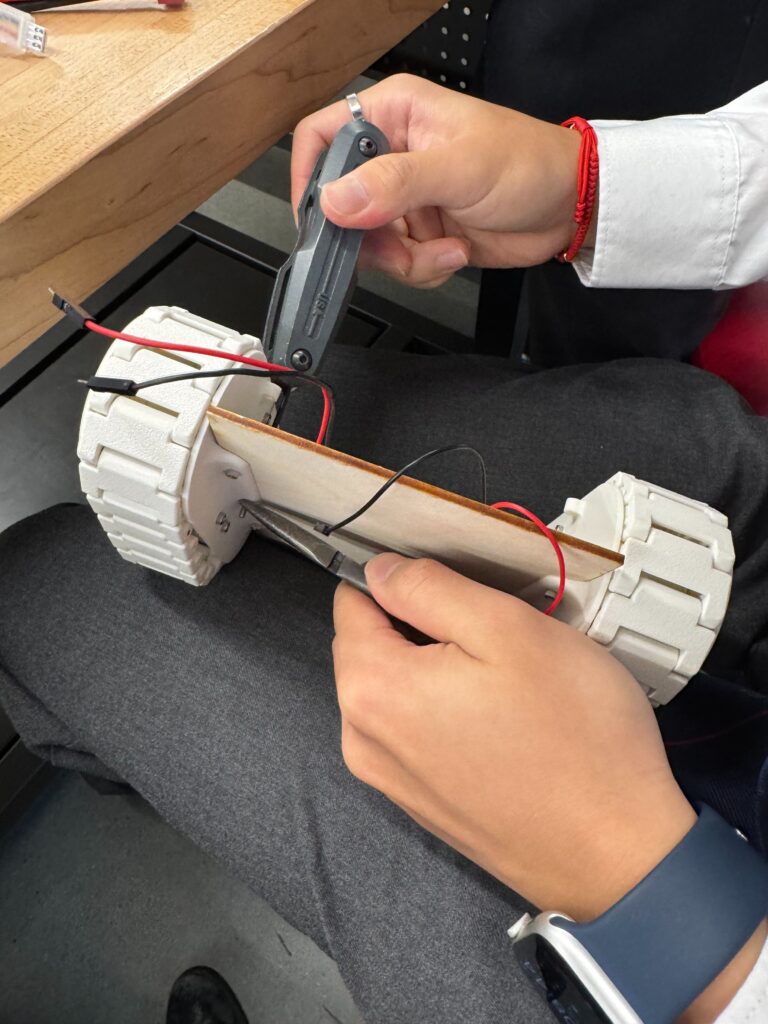
After 3D printing all the parts needed. We have assembled them together into two identical track components. And mounted both track assemblies onto the chassis. This was one of the more challenging steps because the tracks needed to be aligned precisely, and even a small misalignment caused the vehicle to drift to one side. It was only later that we became aware of this issue. We tried to fix this issue by adjusting the alignment again, and using weights to counter act the drift to one side.
Both Track Components assembled onto Chassis
Phase 3: Electronics Integration
We have lowered the level of the chassis and in some trials we have placed the battery underneath the vehicle’s platform to keep the center of gravity low. This decision was intentional: on Callisto, with only 0.126 g of gravity, a top-heavy vehicle would be extremely unstable. Even for our Earth-based prototype, a lower center of gravity improved stability over rough terrain.
Phase 4: Iteration and Fixes
During initial test runs, we noticed the rover was drifting slightly to one side due to uneven tread tension, power ,and weight. We addressed this by:
Re-tensioning the treads on both sides
Ensuring both track assemblies were aligned properly
Adding weights to balance out the forces
This iterative process of test → identify problem → fix → retest was one of the most valuable parts of the project. It showed us that even small manufacturing inconsistencies can have a big impact on performance.
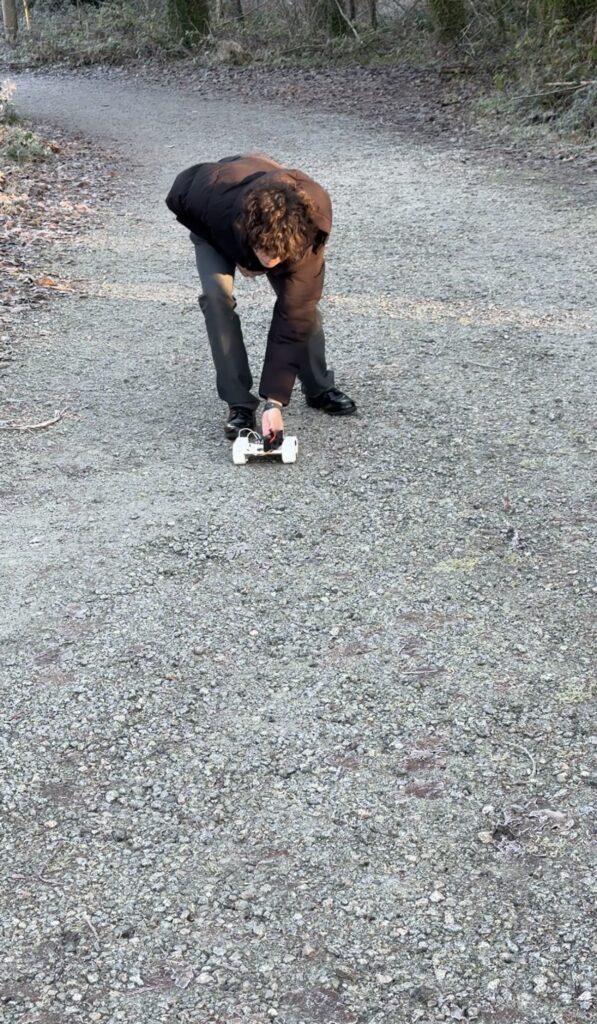
Testing / Data
Test Design
Our testing was designed to evaluate two main performance areas:
Terrain traversal capability: Can the rover reliably cross surfaces similar to Callisto’s cratered, rocky, icy terrain?
Efficiency under load: How much does the rover’s performance reduce when moving from smooth surfaces to rough terrain?
We created the following test conditions:
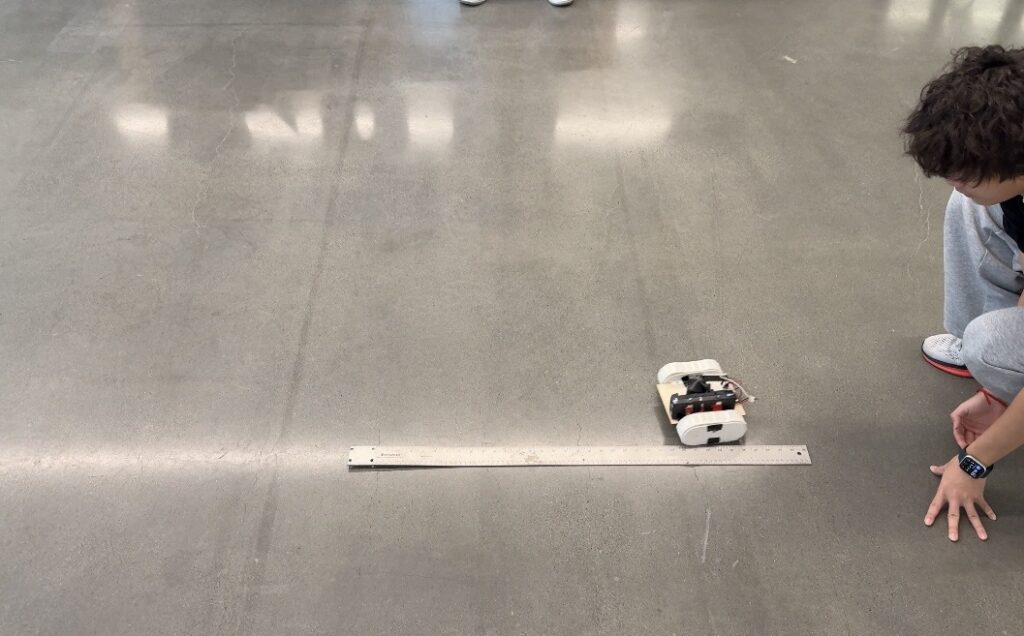
Control Test: Flat, smooth surface. This establishes a baseline speed and performance.
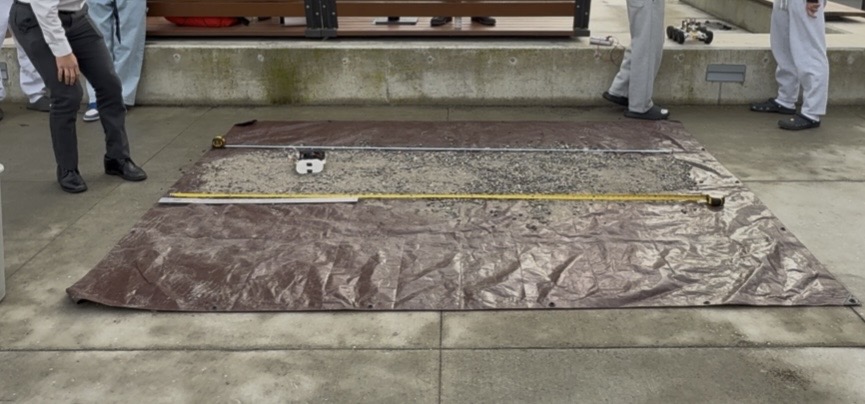
Test 1 — Rocky Terrain: Rocks and pebbles scattered on a flat surface, simulating minor surface irregularities on Callisto.
Test 2 — Inclined Terrain: Few amounts of obstacles along side with inclined hills, simulating crater rims.
Test 3 — Inclined + Rocky Terrain: Significant obstacles including steep inclines and large rocks, simulating rocky areas between settlements and major terrain features.
For each condition, we ran the rover over a measured distance, timed each run with a stopwatch, recorded multiple trials for consistency, and used the same battery charge level across all tests.
Test Results
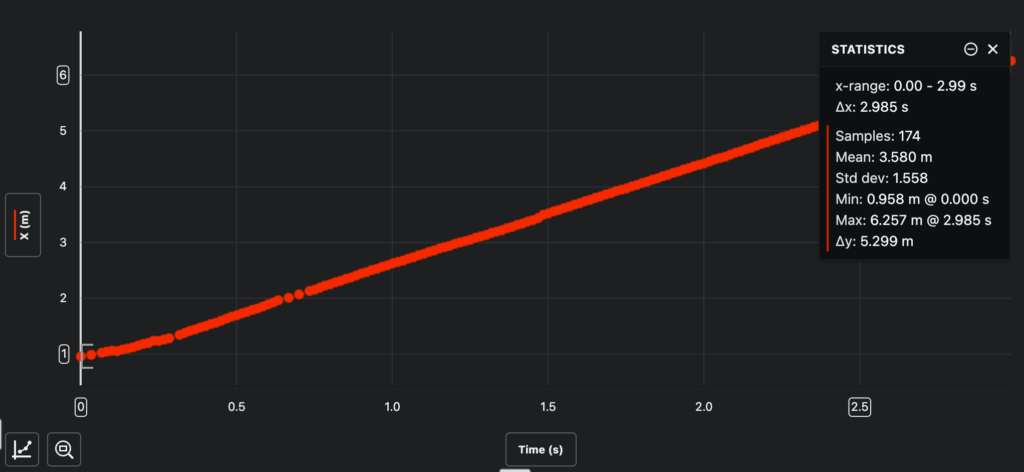
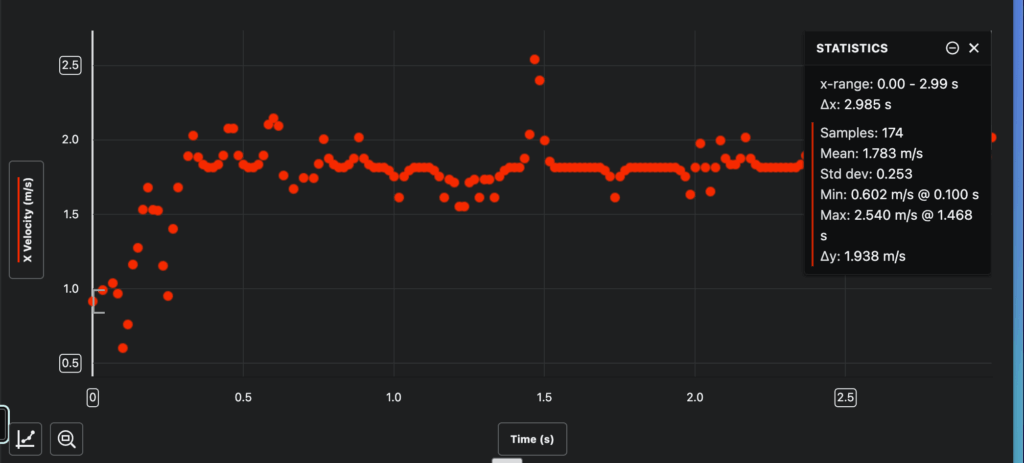
Control Test (Flat Surface):
Trial
Distance (m)
Time (s)
Speed (m/s)
1
5.30
2.99
1.78
Test 1: Rocky Terrain
Trial
Distance (m)
Time (s)
Speed (m/s)
1
1.97
1.54
1.16
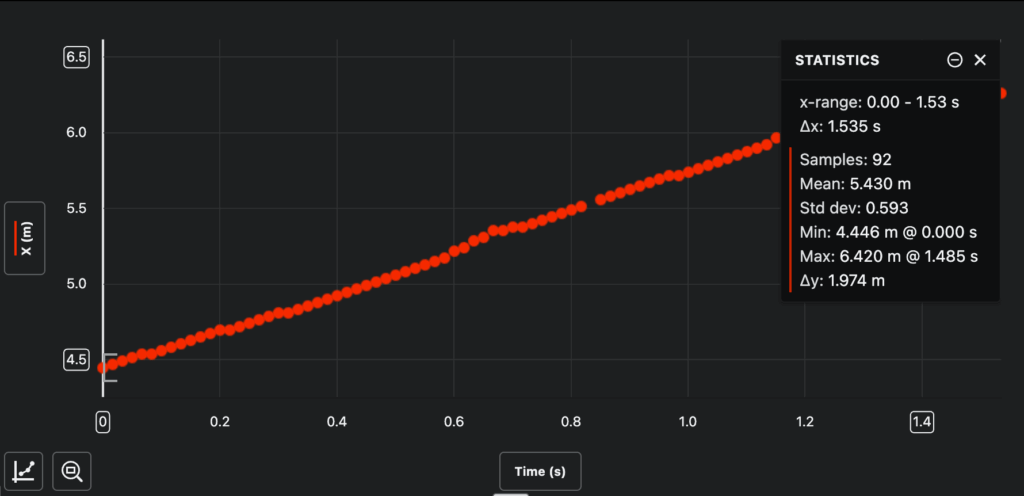
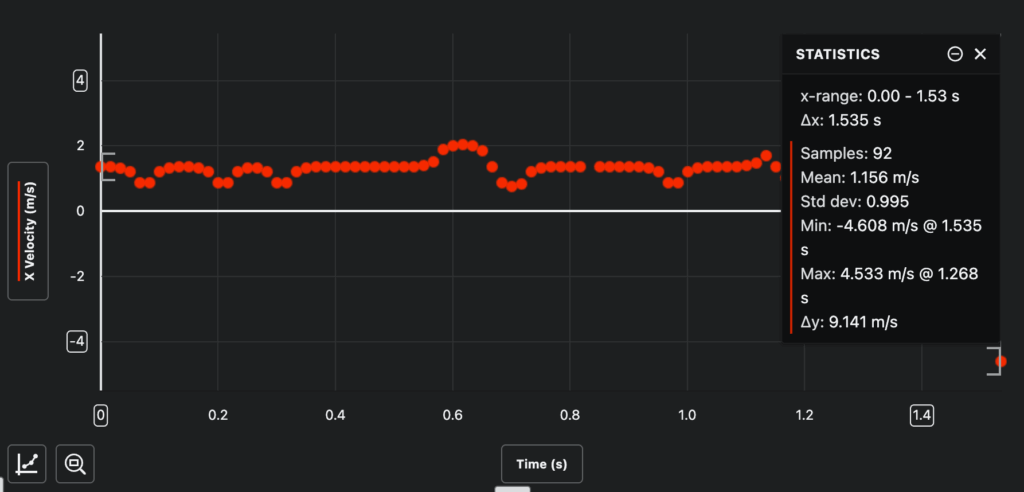
(The velocity and position graphs above were generated from the video analysis website to generate visual representations of the vehicle’s performance on each terrain type.)
Inclined Terrain:
For the inclined terrain test, we captured video footage of the rover navigating inclined terrain with minor obstacles. However, we did not include a meter stick or reference scale in the video frame, which means we cannot perform accurate position tracking or velocity calculations from this footage. The video qualitatively shows the rover successfully traversing the incline, but quantitative data is unavailable for this test condition.
Trial
Distance (m)
Time (s)
Speed (m/s)
1
N/A
N/A
N/A
2
N/A
N/A
N/A
3
N/A
N/A
N/A
Average
No scale reference in video
Inclined + Rocky Terrain:
Trial
Distance (m)
Time (s)
Speed (m/s)
1
N/A
N/A
N/A
2
N/A
N/A
N/A
3
N/A
N/A
N/A
Average
No scale reference in video
Observations During Testing
During testing, we observed several important behaviors:
Control Test: On the flat surface, the rover moved steadily with minimal deviation. The average velocity of 1.78 m/s was consistent throughout the run. We noticed the vehicle maintained a relatively straight trajectory, though there was minor drift to one side due to the motor imbalance we identified earlier.
Rocky Terrain: When traversing the scattered rocks and pebbles, the rover’s speed dropped noticeably to 1.16 m/s, which is a a 35% reduction from baseline. The treads handled the obstacles well, climbing over small rocks without getting stuck. However, we observed increased vibration and occasional slipping happen when encountered with larger pebbles. The vehicle’s low center of gravity proved valuable here, as it remained stable despite the uneven surface.
Rocky + Inclined Terrain: While we captured video footage of these tests, the lack of a reference scale prevented quantitative analysis. Qualitatively, we observed the rover successfully climbing inclines and navigating combined rocky, inclined terrain, though visibly the speed was reduced and occasional wheel slippage on steeper sections.
Analysis
Speed and Efficiency Calculations
I have chosen to define and calculate the efficiency in two separate ways. One is to test it’s efficiency in converting speed on flat surface to rocky terrain. The other is how effectively it converts energy input from the battery into useful energy output (kinetic energy).
To measure our vehicle’s efficiency, we compared its speed on each terrain type to its speed on the flat control surface. This gives us a percentage that represents how well the vehicle maintains performance under increasingly difficult conditions:
Efficiency Formula:
Efficiency (%) = (Speed on terrain / Speed on flat surface) × 100
Given Data: • Vehicle mass (m) = 1.184 kg • Control test average velocity (v₁) = 1.78 m/s • Rocky average velocity (v₂) = 1.16 m/s
Kinetic Energy Calculations (KE = ½mv²):
Control Test: KE₁ = ½ × 1.184 kg × (1.78 m/s)² KE₁ = 0.592 × 3.168 KE₁ = 1.88 J
Test 1 (Rocky Terrain): KE₂ = ½ × 1.184 kg × (1.16 m/s)² KE₂ = 0.592 × 1.346 KE₂ = 0.79 J
This means our vehicle retained 65.2% of its speed capability when traversing rocky terrain compared to a flat surface.
Summary of Results:
Terrain
Avg Speed (m/s)
Efficiency (%)
Control (flat)
1.78
100%
Rocky Terrain
1.16
65.2%
Medium (inclined)
N/A
N/A
Hard (inclined + rocky)
N/A
N/A
Measured Average
1.47
82.6%
Energy Efficiency
Beyond terrain efficiency, we calculated how effectively our vehicle converts electrical energy from the battery into useful kinetic energy. This is critical for evaluating how our vehicle meets real world power demands.
Energy Conversion Efficiency = Kinetic Energy Output (Total Useful Energy Output) (J) / Electrical Energy Input (Total Energy Input) (J) × 100%
Given Electrical Data: • Battery voltage (V) = 7.5 V • Motor current under load (I) = 0.75 A • Control test measured travel duration (t₁) = 2.99 s • Rocky terrain test measured travel duration (t₂) = 1.54 s
We got the durations from the previous graphs analyzed through the video analysis website.
Step 1: Calculate Input Power P = V × I P = 7.5 V × 0.75 A P = 5.625 W
Step 2: Calculate Input Energy Einput = P × t
Control Test: Einput = 5.625 W × 2.99 s = 16.82 J
Rocky Terrain Test: Einput = 5.625 W × 1.54 s = 8.66 J
Step 3: Calculate Energy Conversion Efficiency η = (KEoutput / Einput) × 100%
Control Test: η = (1.88 J / 16.82 J) × 100% = 11.2%
Summary: The vehicle converts approximately 11% of electrical energy into kinetic energy on flat terrain, dropping to 9% on rocky terrain. Based on our research, these values are a bit lower than typical small DC motor systems. Most energy is likely lost to motor inefficiency, friction, and heat, especially when traveling through rocky terrains.
What the Data Means
1. The tracked design performs well on rough terrain. Retaining 65% of baseline speed on rocky terrain is a strong result. The treads successfully distributed weight and maintained grip on uneven surfaces, never stalling or becoming stuck during testing.
2. Energy efficiency drops on rough terrain. Efficiency decreased from 11.2% to 9.1% (a 19% relative drop) when moving from flat to rocky surfaces. This additional energy loss comes from increased friction, vibration, and the work required to climb over obstacles.
3. Kinetic energy analysis. The kinetic energy dropped from 1.88 J (control) to 0.79 J (rocky), which relatively a high reduction. This shows how much the terrain impacts vehicle performance and would be critical for Callisto mission planning.
4. Implications for Callisto missions. On Callisto, rough terrain would require approximately 20% more battery capacity compared to smooth surfaces. Therefore, we would need to plan ahead and factor this efficiency loss into power system sizing and route planning between habitation sites.
Conclusion / Evaluation
What We Learned
This project demonstrated that a tracked vehicle design has clear advantages for navigating through rough, uneven terrain like what we’d expect on Callisto’s surface. The treads provided better traction and stability compared to traditional wheels, and the low center of gravity design helped prevent tipping on uneven ground.
However, the project also revealed several areas where the design would need improvement:
Track alignment: even small misalignments caused the vehicle to drift, which would be a serious issue on Callisto where there’s no one to manually adjust the treads
Weight distribution: placing the battery low improved stability, but the overall imbalanced weight of the prototype affected its ability to climb steep inclines and travel in a straight line
Velocity consistency: our data showed high standard deviation in velocity on rough terrain (0.995 m/s vs 0.253 m/s on flat), indicating continuous acceleration/deceleration. This stop then start motion wastes energy and lowers overall efficiency.
Design Improvements
If I were to redesign / improve upon this vehicle, I would focus on:
Independent track tensioning systems: allowing each track to be adjusted individually without disassembling the vehicle
Suspension system: our prototype had limited suspension, and I see other groups have added a suspension system used to avoid the chassis from taking direct impacts from terrain features. A real Callisto rover would need significant suspension to absorb shocks from crater rims and rocky debris
Motor power balancing: our prototype showed drift due to uneven motor power output. Future designs would need matched motors or electronic control (using like an Arduino board) to maintain the rover traveling in a straight line
Implications for Callisto
When thinking about how this vehicle would perform on the actual surface of Callisto, several factors come into play that we couldn’t fully simulate in our testing:
Low gravity (0.126 g): On Callisto, the rover would weigh only about 12.6% of what it weighs on Earth. This means it would have significantly less traction force pressing the treads into the ground. To compensate, a real Callisto rover would likely need weighted treads or a downforce system. On the positive side, the lower gravity means the vehicle could climb steeper slopes and the impact forces from bumps would be reduced.
Extreme cold (−139°C to −190°C): At these temperatures, standard materials become brittle. The PLA plastic we used for our prototype would break apart instantly on Callisto. A real vehicle would need to use titanium alloys and carbon fiber materials for the chassis, and the treads would need to be made from specialized cold resistant metal links.
Vacuum conditions and heat management: As I discussed in my response to Mr. Crompton’s feedback on PEP 1, heat transfer in a vacuum works very differently than on Earth. There’s no air to conduct or convect heat away, so the vehicle would rely entirely on radiation for cooling. A Radioisotope Thermoelectric Generator (RTG) would provide both electrical power and waste heat for keeping components warm. However, careful thermal design is needed. We can use insulating blankets to retain heat where it’s needed, and radiator panels to release excess heat where it builds up. Without this balance, some parts of the vehicle could overheat while others freeze.
Autonomous operation: With a 35–50 minute one-way communication delay to Earth, the rover must navigate and make decisions entirely on its own. Our prototype does not include a way for remote control, but a real Callisto rover would require sensors (cameras, terrain mapping) and AI navigation systems to identify and avoid obstacles in real time.
Based on our testing, the tracked vehicle concept shows promise for Callisto. The core design principle, using treads for terrain traversal, proved effective even in our simplified tests. With the modifications described above, a sized up version of this design could realistically travel across the 5 km distances between habitation sites on Callisto’s surface.
AI Transparency Statement
I used AI (ChatGPT) throughout the research and design phases of this project. Specifically, AI assisted with:
Research: Understanding complex scientific concepts about Callisto’s environment, including radiation belts, subsurface oceans, and atmospheric conditions. Following feedback from Mr. Crompton on PEP 1, I made an effort to verify AI generated information against primary sources (NASA, ESA, and EOS) rather than relying only on what the AI told me.
Design brainstorming: Exploring different vehicle concepts at the start and evaluating their pros and cons for Callisto’s specific conditions.
Technical understanding: Learning about heat transfer in vacuum conditions, radioisotope power generation, and material properties different temperatures.
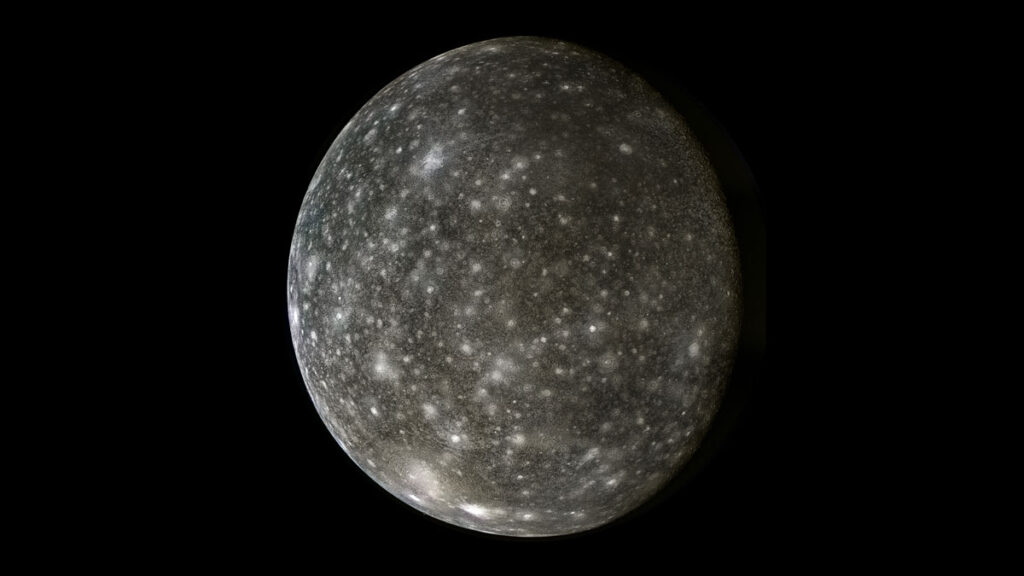
Covered in craters and unchanged for billions of years, Callisto, Jupiter’s second largest moon, appears geologically unremarkable. But even though Callisto looks quiet and lifeless on the surface, scientists have actually found clues hinting that something interesting might be happening deep below its icy crust; where there might be a hidden ocean of salty water.
In this blog post, I’ll talk about why we chose Callisto for our project, what opportunities and challenges it presents for humans, how vehicles could be designed to explore it, and how current scientists have learned about this distant moon.
Reason Behind Choosing this Planet
One of the main reasons we chose Callisto is that it orbits outside of Jupiter’s radiation belts, making it the safest major Jovian moon for human to be located on. The radiation belt is filled with high energy particles trapped by the planet’s magnetic field. Specifically, these radiation belts can damage spacecraft. Moreover, any human landing on an inner moon such as Europa would receive a lethal radiation dose in just a few hours (European Space Agency, 2023).
In addition, Callisto’s terrain is stable for construction, vehicles, and long-term residence. Unlike lo (another moon of Jupiter), Callisto doesn’t have any volcanoes or large mountains on its surface. Its lack of geological activity, both above and below its surface, suggests that its surface most likely looks like what the satellite looked like during its formation. (NASA,2025) The reason behind that is mainly due to the lack of tidal forces nearby Jupiter. Without squeezing and pulling forces from Jupiter’s gravity, this reduced the heat and energy within Callisto, resulting in relatively low geological activity (Ruiz, 2012).
Finally, another reason we chose Callisto was that there’s evidence showing that it may contain an underground ocean beneath its icy crust. Magnetic field measurements from the Galileo spacecraft suggest that a salty, electrically conductive layer exists deep below the surface, likely similar in salinity to Earth’s oceans. While there are still several aspects that scientists are not sure of, this makes Callisto as an exiting planet to explore that could possibly sustain human life.
Potential Opportunities
Data from NASA’s Galileo spacecraft detected regular fluctuations in the moon’s magnetic field as it orbited Jupiter. These fluctuations suggest there are electrical currents within the moon, and since Callisto’s surface is a mix of rock and ice with only a thin atmosphere, scientists concluded that the most likely source of those currents is a salty, liquid ocean beneath the ice. NASA explains that Callisto’s ionosphere alone cannot explain all existing observations. And only a combination of the ionosphere and a conductive subsurface ocean can explain the magnetic changes detected. According to Nature, this ocean would need to have a salinity similar to the Earth’s oceans to produce the level of electrical conductivity measured by Galileo.
Furthermore, a post from EOS claims that this ocean is likely located tens of kilometers below the surface. This ocean would be encased beneath a solid ice shell that could range from tens to hundreds of kilometers thick, making Callisto a great site for astrobiological research (space.com).
In addition to its potential subsurface ocean, recent laboratory experiments at the National Synchrotron Radiation Research Center in Taiwan suggest that Callisto may contain ozone within its surface ice, and important prebiotic (time before life existed) molecules such as amino acids, could form under Callisto’s extreme conditions. Researchers simulated Callisto’s icy environment by freezing sulfur dioxide ice in a vacuum chamber and exposing it to ultraviolet radiation (conditions similar to those on the moon). The radiation broke apart the sulfur dioxide molecules, freeing oxygen atoms, which then combined into oxygen molecules and eventually formed ozone. Ozone’s ability to absorb harmful ultraviolet radiation creates a more stable chemical environment on Callisto’s surface, where complex organic molecules like amino acids could potentially form. Amino acids are the essential building block of proteins, which are critical for all known forms of life. Therefore, if ozone is present on Callisto, it suggests that the moon may have chemical conditions necessary to support prebiotic chemistry.
Potential Challenges
Though Callisto presents opportunities for exploration and long term settlement, Callisto is a challenging environment that requires advanced technology and human endurance.
Its atmosphere is extremely thin, composed mainly of carbon dioxide and a bit of oxygen, with a pressure millions of times lower than Earth’s. With no atmospheric pressure, meaning that all systems must be fully sealed and pressurized.
The temperature is extremely cold, ranging from approximately -139 to -190 degrees celsius. A result of this is the materials like metal and plastic becomes so brittle and makes normal mechanical movement difficult.
Because the moon receives only around 4% of the sunlight Earth does, there’s almost no solar energy possible to be acquired.
We couldn’t ignore the fact that Callisto is very distant from Earth (about 628 million kilometers away), this could result in communication delays of up to 50 minutes one way.
This delay makes it impossible to control equipment / systems in real time, so systems must be capable of operating and solving problems on the moon themselves.
Rockets must use significant fuel to reach and land on Callisto, meaning we would need and transport significant amounts of resources.
By Apollo 17 Picture of the Whole Earth
Vehicle Design
Because the lack of sunlight on Callisto, using solar power is not practical, so vehicles must rely on another energy source like compact nuclear reactor.
Insulation, thermal, and internal heating systems are definitely needed to protect batteries, and prevent human and mechanical parts from freezing.
All designs must consider and operate in vacuum conditions, where heat cannot escape easily, requiring temperature control for both warming and cooling.
With no atmosphere and icy surface, wheels must be designed for low gravity with spikes for traction.
The rover should use withstanding materials like titanium or carbon fiber to deal with temperature fluctuations and vacuum environment.
As mentioned previously, there is almost a 50 minute communication delay to Earth, therefore, rovers must be able to navigate and operate independently.
How do we gather information about Castillo?
Before spacecraft missions took place, Callisto was first observed as a small point through telescopes, this provided scientists only basic information about its size and orbit.
Afterwards in 1979, Voyager 1 & 2 provided the first close image of Callisto, revealing that its heavily cratered.
Galileo Orbiter (1995-2003) was then sent out, and this was the most important mission for studying Callisto. It performed multiple flybys and gathered data using more specialized instruments. For instance, it detected magnetic field fluctuations caused by Jupiter, identified ice and carbon dioxide on the surface, and acquired measurements that allowed scientists to model the moon’s internal structure.
Finally, laboratory simulations also played a huge role in researching, where scientists recreated conditions similar to Callisto in vacuum chambers on earth, to study ozone and prebiotic chemistry.
Usage of AI
I have used AI in the research phrase of this project to help me better understand complex scientific concepts related to Callisto.