Intro:
If you are unfamiliar with the project my team and I are doing, here is the definition statement that lays out our task at hand:
Our team must design an efficient transportation method on a foreign celestial body, both without wasting excess energy and without wasting time, capable of a 5-kilometre-long round trip on Ganymede, one of Jupiter’s moons. This vehicle must handle extreme conditions including temperatures as low as -180C, low gravity(a tenth of Earth’s), rocky terrain, and interference from the planet’s magnetic field affecting electronics.
Method/Procedure:
After we were given our problem and created our definition statement, we brainstormed through many different ideas as for what type of vehicle we could build. We sifted through a ton of different designs, ranging from jetpacks to motorcycles, and even drones or helicopters. Ultimately, we decided that given the low gravity and freezing conditions on Ganymede we would build a car like vehicle.
We also came up with a list of potential ideas that we could implement on our vehicle if it was real:
Hybrid Drivetrain: Would offer high Rpm power of combustion engine and low end torque of an electric motor.
Low PSI Tires: Allow us to easily crawl over the rocky terrain as these are typically found on rock crawlers on earth
Spikes or Chains on the Tires: Would allow the tires to get extra grip on the icy surface.
Lots of Suspension Travel: Many rock crawlers on earth have great amounts of suspension travel. This allows for a good off-road approach angle. It prevents the underside of the vehicle from being damaged on rocks.
From these ideas, we created our first sketch for what our vehicle could look like:
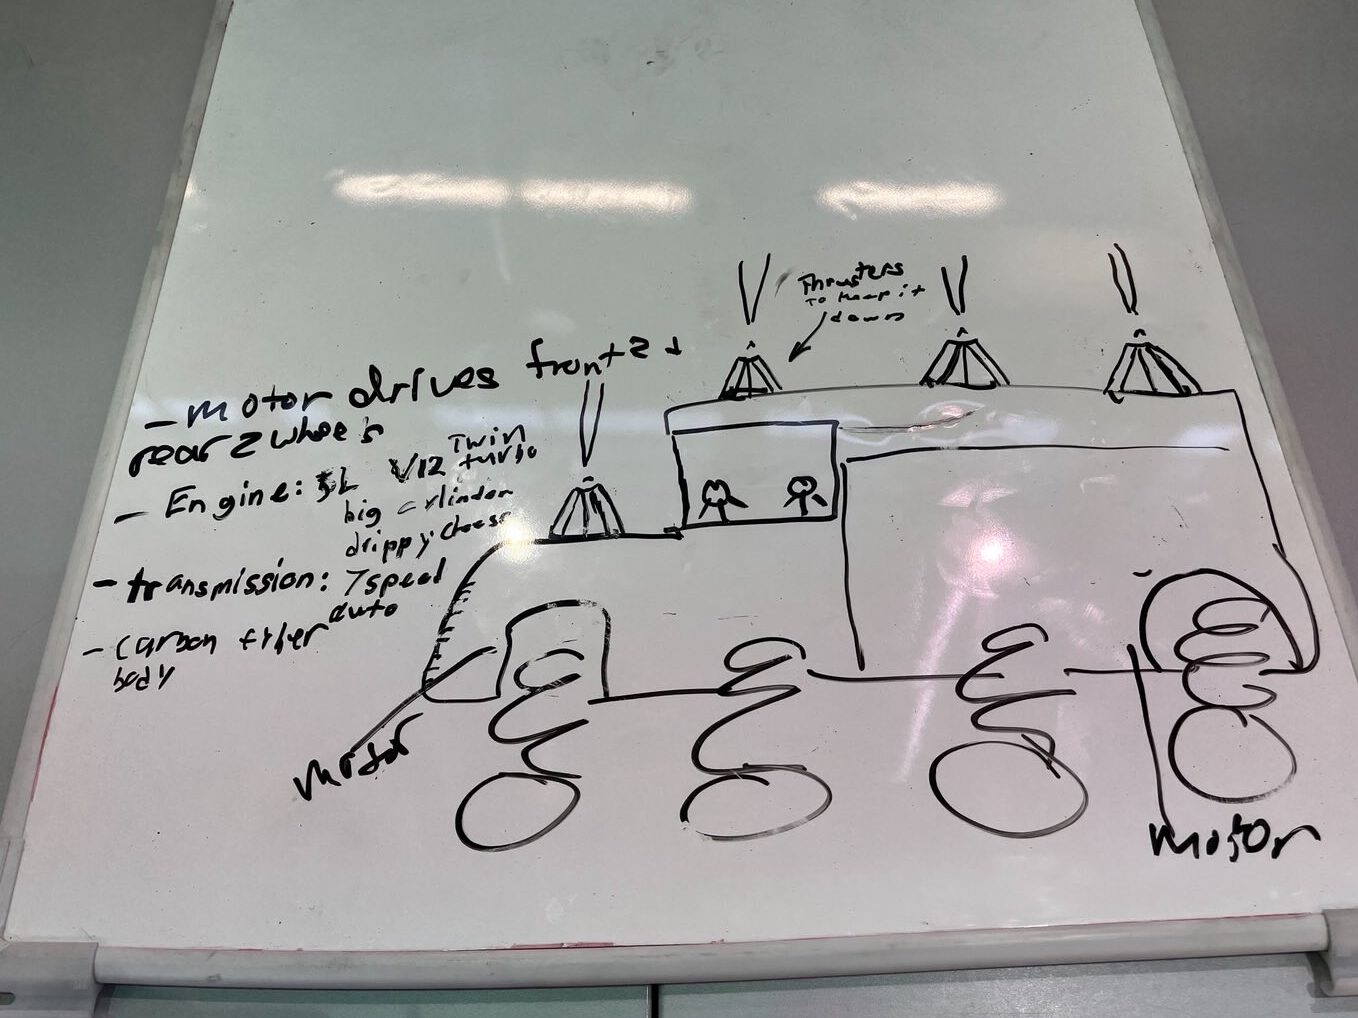
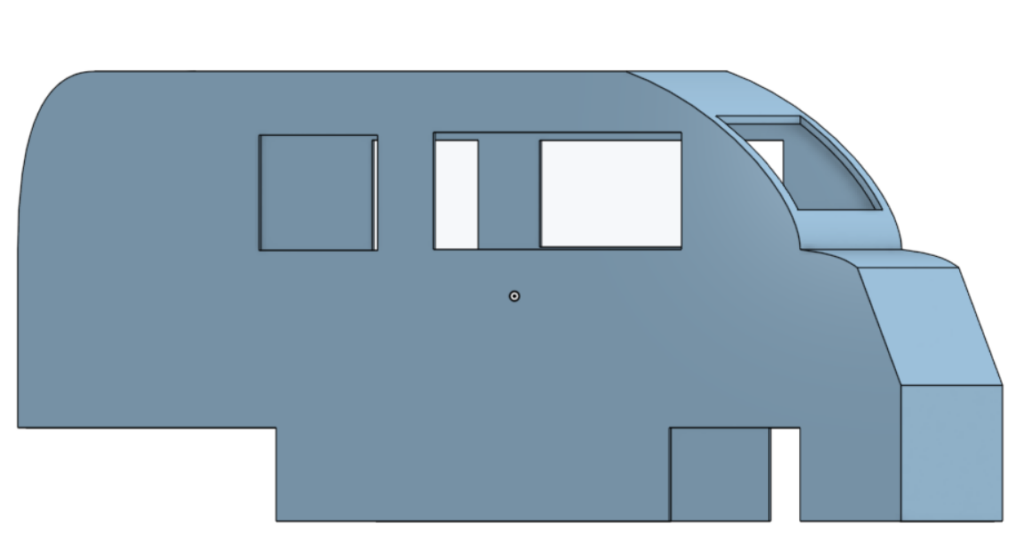
Next, we had to actually start designing and building our vehicle. This process proved that some of our designs were going to be challenging to implement. We ditched the 4 axle design in favor of a more traditional 2 axle system. We found a chassis with motors and steering to serve as the platform for which we designed our vehicle. We designed in On shape a body to fit onto our vehicle, which if in life size form could actually fit four people.
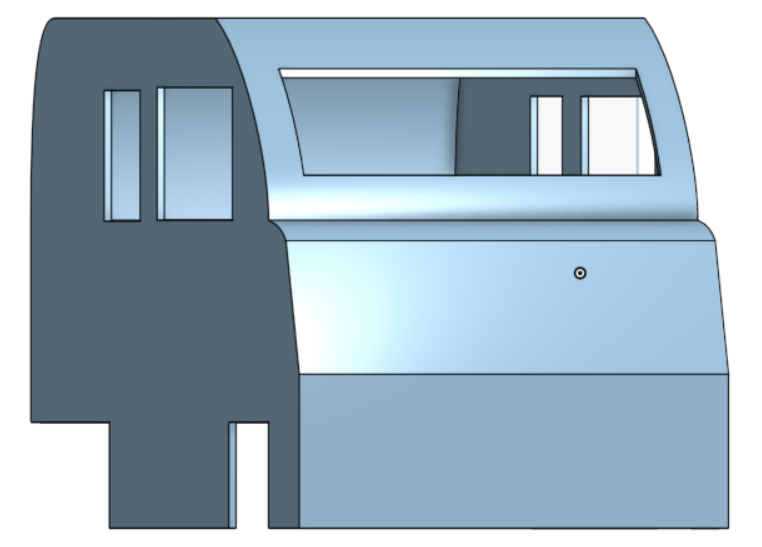
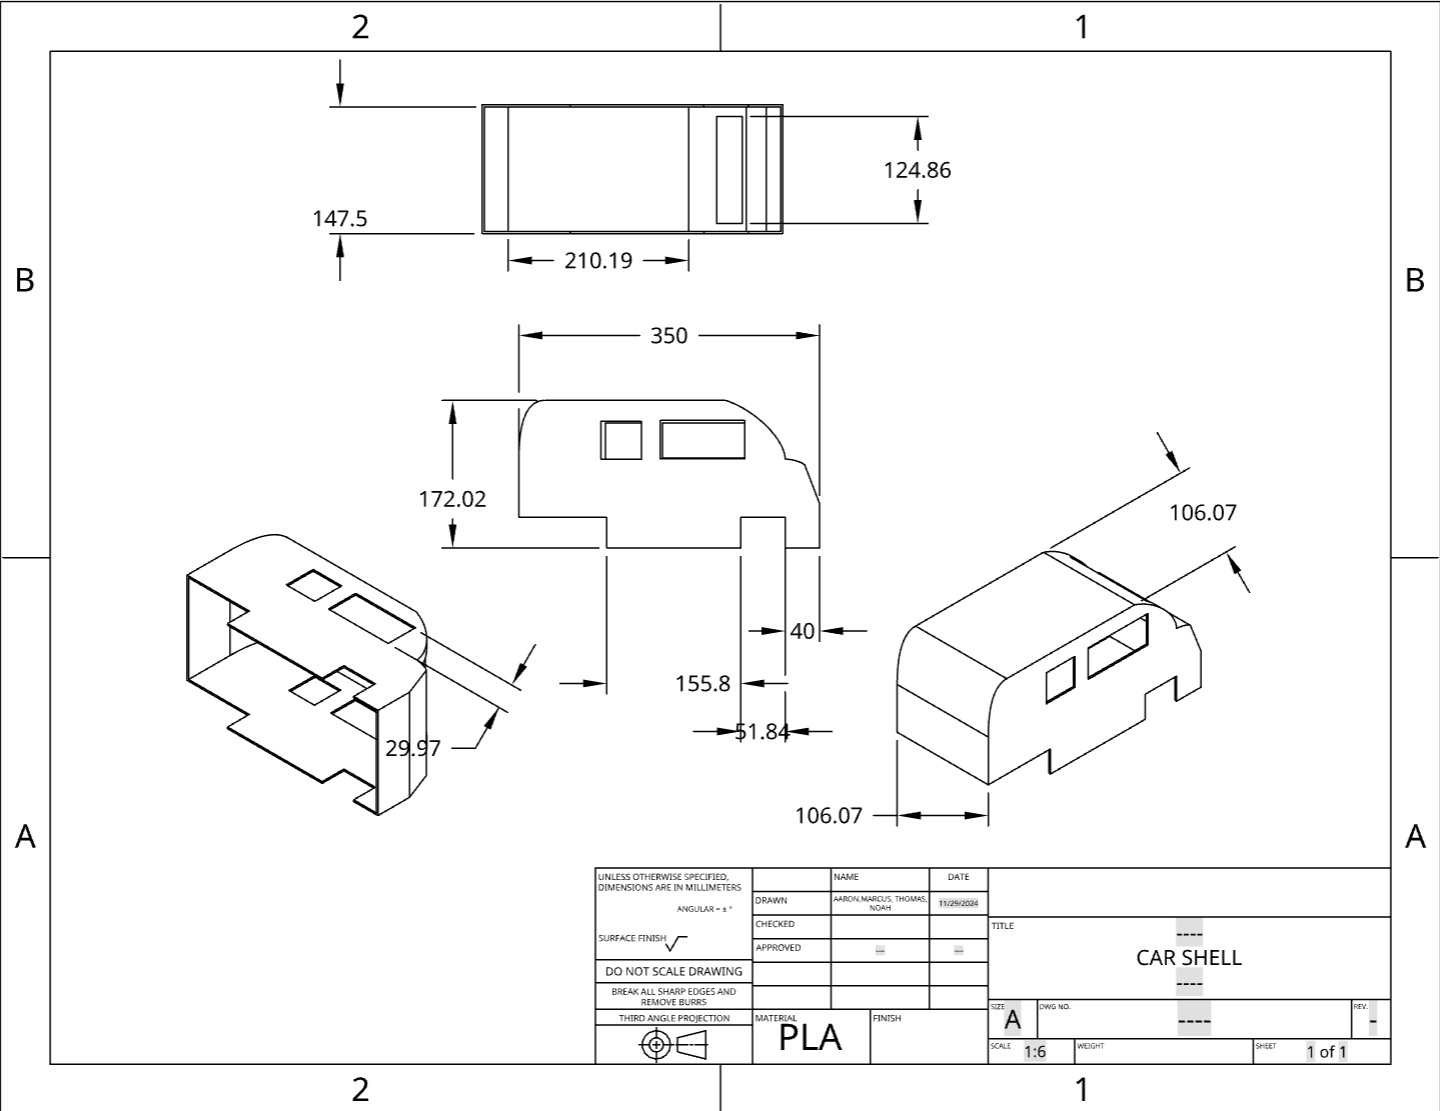
We then printed this body and attached it to our vehicle, and then designed the test and testing environment.
Testing:
To test our vehicle, my team and I created a testing statement for which we would create our test off of:
We are testing the vehicle’s capability of navigating icy and rocky terrain, conditions similar to those of Ganymede. To test these, we are considering small ice cubes, mimicking the frozen surface-level terrain, as well as dirt and larger rocks.
We designed a testing environment consisting of rocks and sand similar to the rocky terrain of Ganymede. Unfortunately, we were not able to source ice in time for our experiment. As a result, our data does not include the slippery ice.
We tested the efficiency of the vehicle based the amount of time it takes to complete an off road course compared with how long it takes to complete a similarly lengthened course on just flat concrete. These times will show us if the vehicle is as efficient on the road as it is off the road. Additionally, we created three different off road courses, being easy, medium and hard difficulties. We did this as a planet such as Ganymede with its rocky terrain has varying terrain and is different all throughout. Here are the descriptions and data of each type of test.
Control Test:
Test is on flat concrete without any inclines or hills. Simply to test the speed the vehicle is capable of for reference to other tests. This is Video One And Two on the Raw Data.
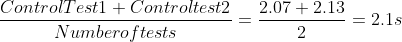
To calculate the average time of the vehicle we used a video analysis software. The two runs resulted with a time of 2.07 seconds and 2.13 seconds. This results in an average of 2.1 seconds to complete the run.
The Formula is:
To calculate the average distance completed we also used the video analysis app. To calculate the average for our control tests we do:

Then, to calculate our overall average speed for the control tests we do:
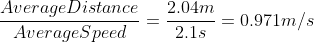
This means that the speed of the car on a flat surface is 0.971m/s.
Easy Level tests:
Medium Level Tests:
Hard Level Tests:
Analysis:
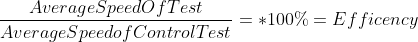
Before my analysis, this is how efficiency will be measured:
Easy tests:
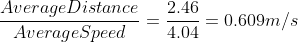
These tests featured a rocky and sand terrain with a small hill at the end of it. The fairly simple terrain did not prove to challenge the vehicle and it was able to complete it without any challenges in the hands of a variety of different operators with varying experience.

With a roughly 60% speed efficiency the vehicle did extremely well when put into its real world testing environment.
The Easy Tests are Videos 4 and 5 on the google drive linked at the bottom.
Medium Tests:
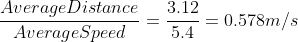
These test featured more challenging terrain than the easy tests, and the vehicle was actually faster on the medium terrain than it was the easy. This shows that the vehicle is clearly still very capable on the medium terrain and is not struggling to complete them in a timely matter yet.

Since it has a slightly higher efficiency than the easy test, this means that the vehicle is not being strained and is able to complete it at the same speed if not faster. This likely means though that the terrain probably wasn’t as challenging as it should have been, because if it was actually more challenging the vehicle would have taken longer and the efficiency percentage would have been lower.
The medium tests consist of video 7 and 8 in the google drive linked below.
Hard Tests:
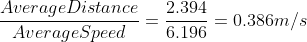
The final tests of our vehicle featured the most challenging obstacles yet, including a massive hill at the end of it which really put the traction and capabilities of our vehicle to the test. This is shown as our vehicle was only able to reach 0.386 m/s compared to the control tests 0.971 m/s.

If you watch the videos of the hard tests, it shows that when it reach’s the final hill the wheels begin to slip and it takes a while for the car to climb over the hill. This is likely due to the extra weight added from the 3d printed shell that we added to the car. It caused it to lose some of its agility and suspension travel which affected its results in the challenging environment.
Average Efficiency and Speed of all test environments:
The average speed is 0.578 + 0.609 + 0.386 = 1.573/3 = 0.524 m/s
The average efficiency is 59.5 + 62.7 + 40 = 162.2/3 = 54%
These averaged results are what the results would be on Ganymede as it has a mix of all three types of surfaces.
Based off of these results I believe that our vehicle is sufficient enough to drive on Ganymede as it is capable of over 50% its top speed. This means that it is capable enough to traverse Ganymede in a timely matter, and ultimately complete our original goal well, the 5km round trip.
Conclusion:
In conclusion, we designed and tested at the end of the day I believe is capable of traversing Ganymede not only well but also efficiently. If I was to do this project again, I think I would’ve liked to design more of my own parts for the car and maybe try creating different types of tires and tire compounds to test the vehicle with. Overall I am happy with the way the vehicle turned out and hope that one day I will see the real implementation of a vehicle on Ganymede.
AI Discloser Statement:
The only time I used AI on this project was to help find the formula in which I calculate efficiency. I asked this as I wanted to make sure I used the right formula and didn’t end up with unusable numbers. However, all calculations were done on my own.
Transcript:
How do I calculate efficiency when I have a control test and then an actual test?
The formula:ActualControl×100%\frac{\text{Actual}}{\text{Control}} \times 100\%ControlActual×100%
calculates the percentage of the actual result relative to the control.
Interpretation:
- If the result is 100%, the actual and control values are the same (no change).
- If the result is greater than 100%, the actual value is higher than the control (increase in value).
- If the result is less than 100%, the actual value is lower than the control (decrease in value).
Example:
If your control test result is 10 and your actual test result is 8,810×100=80%\frac{8}{10} \times 100 = 80\%108×100=80%
This means the actual result is 80% of the control value, or a 20% decrease from the control.
Would you like to apply this to a specific situation?
Google Drive:
Here is the links to…
Leave a Reply