Introduction
In Part 1 of this project, our group researched Proxima Centauri B and came away with a picture of a planet that is roughly Earth-sized but drastically different in almost every other way. It’s tidally locked, so one face permanently stares at the star, it’s bombarded by stellar radiation from a flare-active red dwarf, it’s probably rocky, likely has little to no breathable atmosphere, and it’s subject to extreme temperature differences between the lit and dark hemispheres. While this is exciting as a concept, it’s brutal as an engineering environment.
Part 2 was the harder test. We had to stop speculating, build something, and find out what is actually true.
Definition Statement: Design and build a strong, efficient vehicle capable of consistently and safely travelling a 10 km round trip on uneven, rocky terrain with inclines, while providing a platform that could later support radiation shielding and thermal management for three astronauts.
Because we cannot recreate 1.3x gravity, zero atmosphere, or cosmic radiation on a school campus, we scoped our physical tests around what we can genuinely measure: mobility, suspension behaviour, energy efficiency on flat terrain, and energy efficiency on an incline. The non-testable factors like shielding mass and thermal insulation, were addressed through calculation and design rationale rather than pretending to test them. The role of testing in this project is specifically to measure how much energy the prototype consumes per meter and whether the suspension keeps all wheels in contact with uneven ground. Those two data points then become the input for extrapolating what a real vehicle would need to survive a 10 km mission on Proxima B.
Stage 1: Identify the Problem
Weeks 1–2
The core challenge for Part 2 was narrowing “design a vehicle for an alien planet” into something testable at school. Proxima B’s most extreme features cannot be simulated in a classroom. But mobility on rough terrain can be.
The working assumptions we locked in were: rocky and uneven surface, approximately 250 K ambient temperature (−23°C), 1.3x Earth gravity, little to no atmosphere, and high radiation exposure from frequent stellar flares. From these, two engineering requirements dominate the design:
- The vehicle must handle rough terrain reliably, covering suspension, traction, and ground clearance.
- The vehicle must protect its passengers and electronics from radiation and temperature extremes.
For the prototype, we focused on requirement 1 since that is what physical testing can actually evaluate. Requirement 2 was addressed in the design concept through material and shielding rationale, not a build test.
Stage 2: Design Prototype
Weeks 2–5
Design Sketches
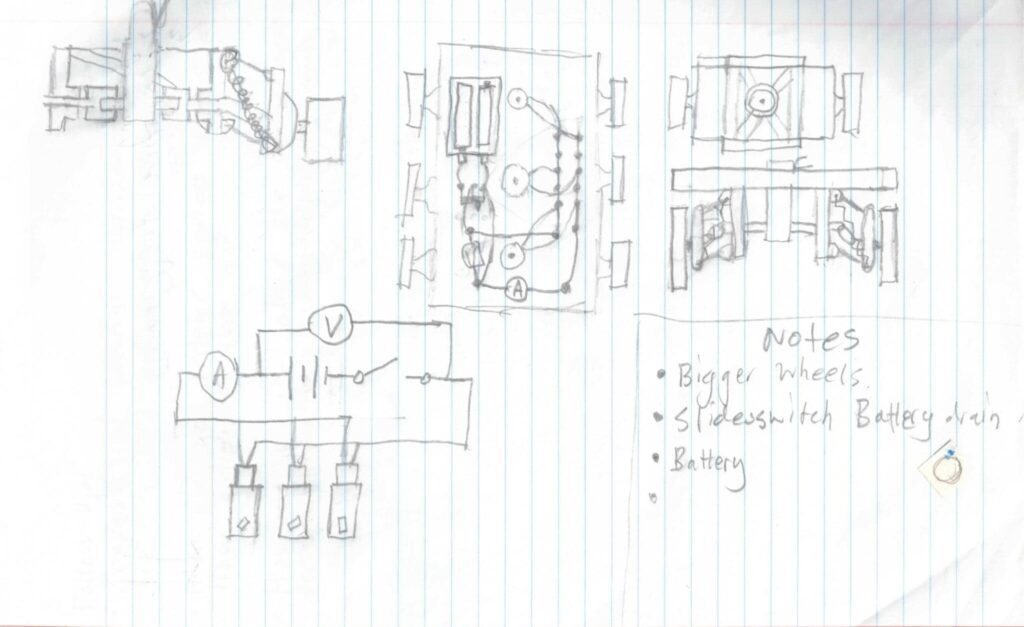
The design process started with hand-drawn sketches to map out the mechanical layout before committing to CAD. Sketching forced decisions early: how many wheels, where motors sit, how the suspension attaches, and where electronics live. These sketches are rough by definition. That is the point. Getting bad ideas onto paper quickly is faster and cheaper than building them.
Design Overview
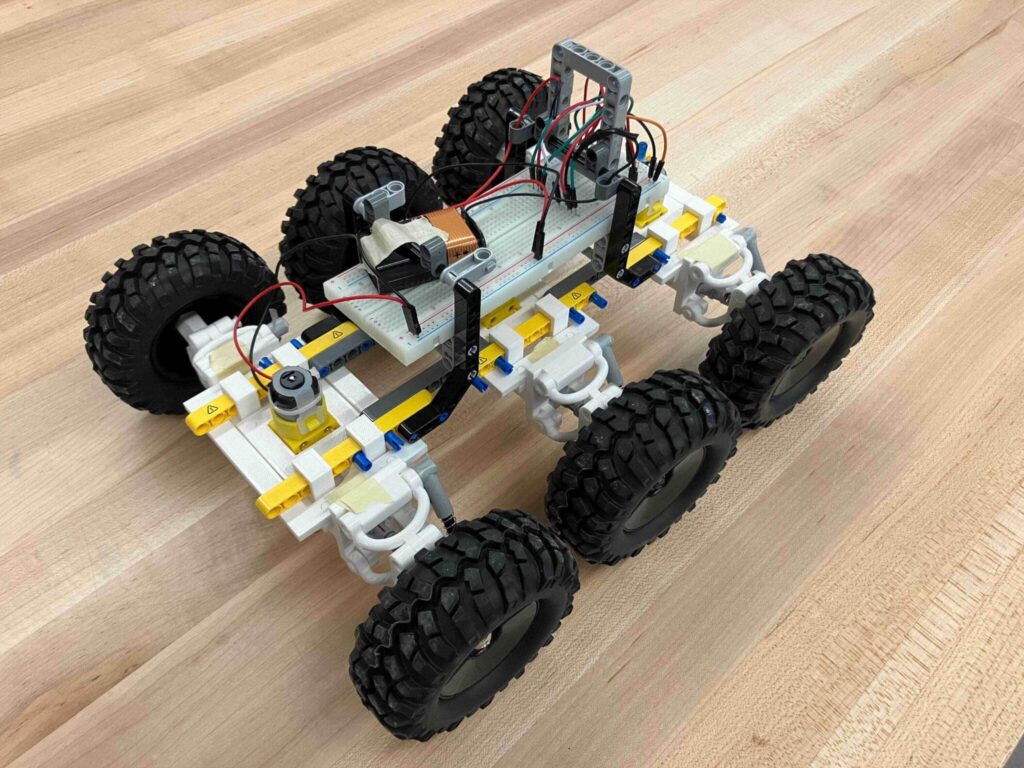
The final design is a six-wheeled vehicle driven by three dual-shaft motors, approximately 320 mm long and 230 mm wide. Instead of one large chassis, the design uses three independent modules where each module drives one pair of wheels. The three modules connect to form a single base plane, with electronics mounted centrally on top for balance and accessibility. The outer casing for radiation and thermal shielding is deliberately excluded from this prototype. It is a future-iteration problem. For now, the objective is to prove the drivetrain and suspension work.
Modular Design
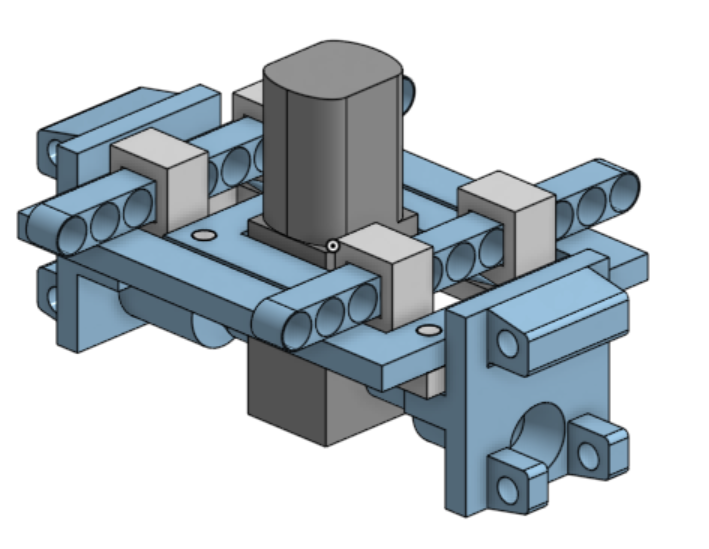
Three modules instead of one unified structure saves motors. You need one dual-shaft motor per module rather than six separate motors for six wheels. It also reduces weight and lets you isolate problems. If one module fails, it fails independently rather than taking the whole drivetrain with it. Each module is self-contained: one motor, two suspension systems, two universal joints, and two wheels. The three modules then bolt together to form the complete base plane.
Suspension System
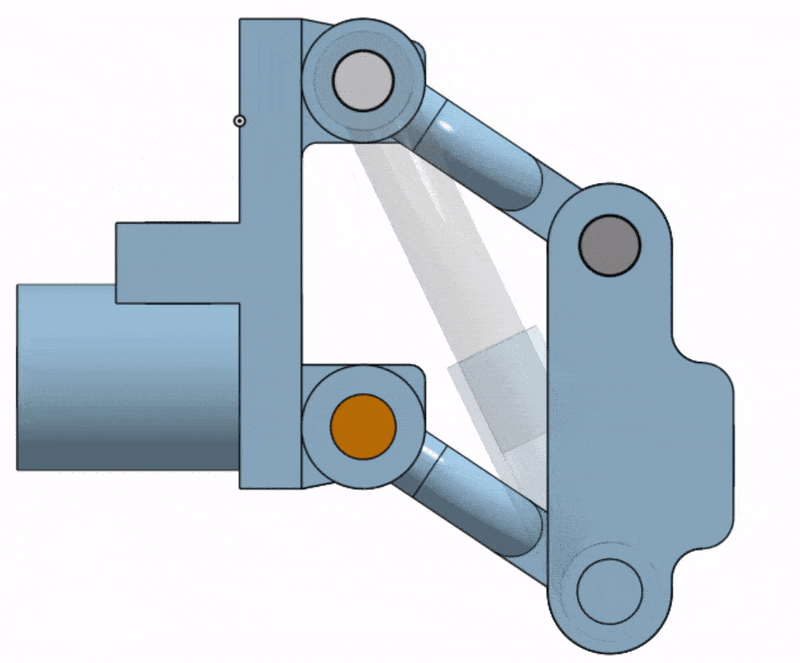
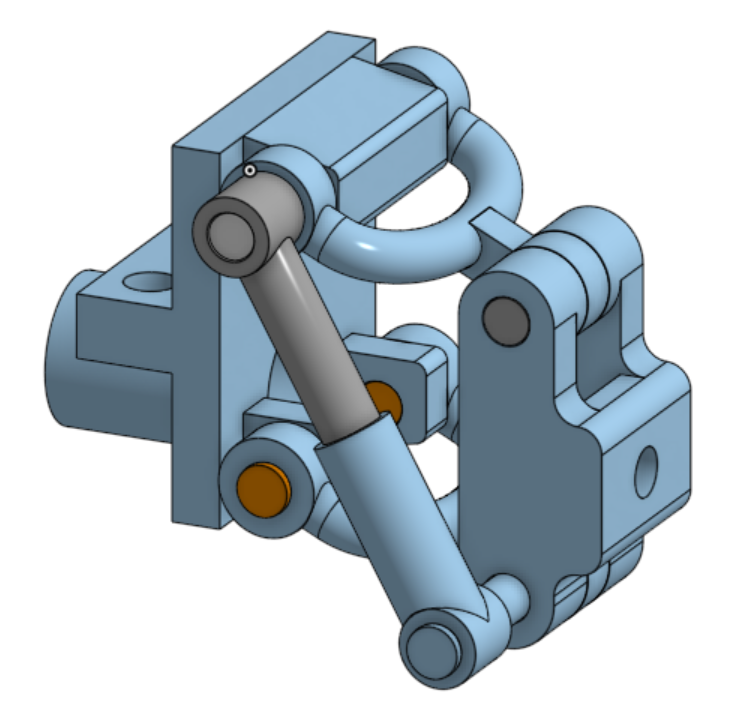
The suspension is the most critical feature for a rocky terrain vehicle. Each wheel has its own independent suspension based on a double wishbone geometry. The system consists of a spring, a frame, two coupler arms, and a wheel holder that together form a four-bar linkage. What the four-bar linkage accomplishes is constraining the wheel to move up and down without the wheel tilting sideways or the body pitching violently. The spring absorbs impacts and returns the wheel to its neutral height.
On a planet with 1.3x Earth gravity, a spring calibrated for Earth conditions will compress harder and bottom out faster under the same load. That is a real design constraint for the final vehicle that this prototype helped us think through concretely. Spring preload and stiffness need to be tuned to the gravitational environment, not just copied from Earth hardware.
Universal Joints
With independent suspension, wheel height changes constantly as terrain varies. If the axle connecting the motor to the wheel cannot handle that angle change, it binds or breaks. Universal joints solve this. They transmit rotation even when the two connected shafts are not aligned. The original plan was to 3D print these, but printed universal joints could not handle the motor torque at the resolution our printer could achieve.
We switched to LEGO Technic universal joints, which are small, precisely manufactured, and strong enough for the motor output. This is a small part with large consequences: without functional universal joints, the drivetrain fails the moment any suspension travel occurs.
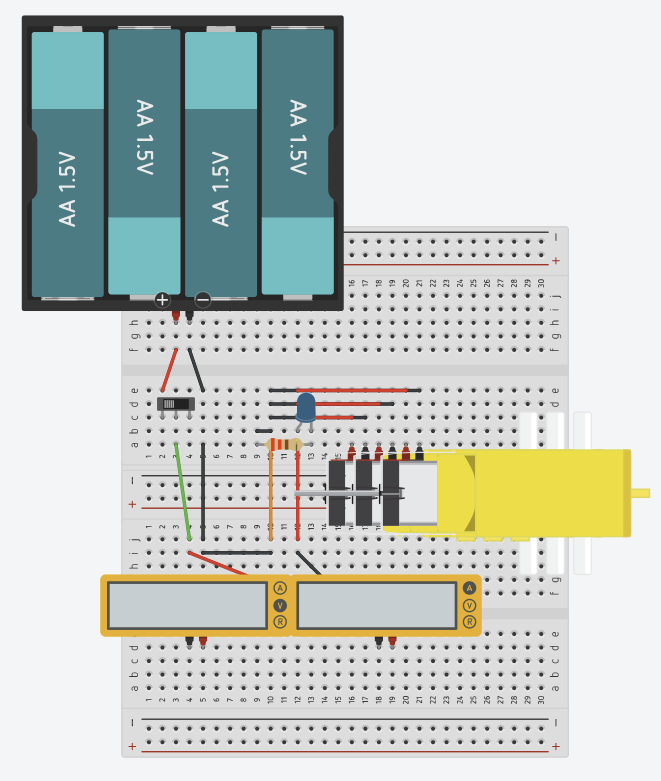
Design Electronics
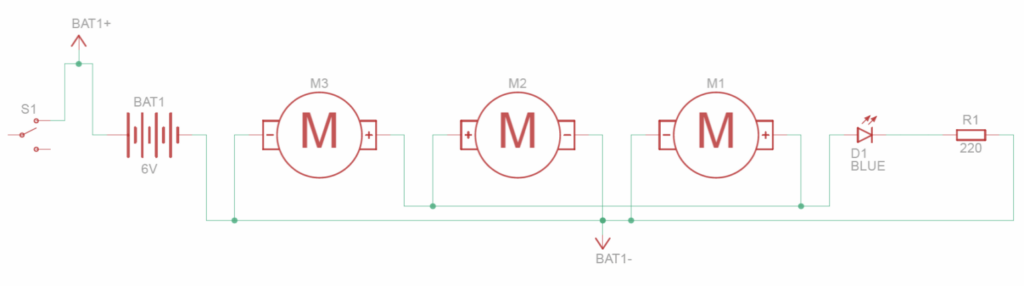
The circuit connects a 9V battery through a slide switch to three hobby gearmotors in parallel, with a blue LED through a 220 Ω resistor indicating power-on state. To make voltage and current measurement straightforward during testing, we added parallel wires to the main positive line for voltmeter attachment, and split the main line into two in-series sections to allow an ammeter insertion between them. The voltmeter is non-invasive. The ammeter setup lets us disconnect and reconnect without disturbing the rest of the circuit. The circuit was adjusted slightly from the original design when building the physical prototype, since the breadboard layout needed to accommodate the physical wire routing.
Bill of Materials
| Material | Type | Amount |
| Lower Body – Motor Holder | 3D printed | 3 |
| Lower Body – Motor Adaptor | 3D printed | 6 |
| Lower Body – Wheel Adaptor | 3D printed | 6 |
| Lower Body – Plate | 3D printed | 3 |
| Upper Body – Plate | 3D printed | 6 |
| Suspension – Center Half | 3D printed | 6 |
| Suspension – Wishbone | 3D printed | 12 |
| Suspension – Axle Holder | 3D printed | 6 |
| Axle – 10mm, Round, Endcap | 3D printed | 12 |
| Axle – 20mm, Round, Endcap | 3D printed | 6 |
| Axle – 35mm, Round, Endcap | 3D printed | 6 |
| Axle – 43mm, Round, Endcap | 3D printed | 6 |
| Breadboard | Electronics | 1 |
| 9V Battery | Electronics | 1 |
| 9V Battery Head | Electronics | 1 |
| Blue LED | Electronics | 1 |
| Slideswitch | Electronics | 1 |
| Resistor (220Ω) | Electronics | 1 |
| Hobby Gearmotor | Electronics | 3 |
| Wires (Male to Male) | Electronics | 8 |
| Toothpick | Other | 6 |
| Wheels | Other | 6 |
| Technic – Universal Joints | LEGO | 12 |
| Technic – Springs / Shock Absorber | LEGO | 6 |
| Technic – Spacer / Bush | LEGO | 8 |
| Technic – Beams | LEGO | 22 |
| Technic – Axle | LEGO | 8 |
| Technic – Pin | LEGO | 24 |
Stage 3: Build the Prototype
The assembly took three weeks and taught lessons that CAD does not teach until something physical fails.
Our Learnings from Failures:
- Printing Tolerance: Parts that fit perfectly in Onshape do not automatically fit when printed. For circular connections, I found that a 5 mm hole diameter paired with a 4.75 mm axle gave reliable clearance without slop. Getting there took multiple trial prints.
- Printing Precision and Material Strength: 3D printing builds in layers, which means parts are weakest perpendicular to those layers. Several components broke along layer lines during assembly. Reorienting those parts so that stress points load along rather than across the layers fixed the problem. The universal joints were a harder case: the geometry is too fine for the printer’s resolution to produce something strong enough for motor torque. That is why we switched to LEGO units.
- Wheel Size: The first wheel set had a 60 mm diameter, which showed up as a huge limiter in testing. When the rover rolled onto rough terrain, the chassis scraped the ground. Upgrading to 95 mm wheels fixed ground clearance and improved traction on uneven surfaces.
Stage 4: Test the Prototype
We ran three tests: a qualitative suspension test and two quantitative efficiency tests.
Suspension Test
We tested two wheel sizes (60 mm and 95 mm) across flat surfaces, angled slopes, and rough gravel terrain. The goal was to observe whether each wheel could adapt to different heights independently without destabilizing the body. Both wheel sizes showed consistent ground engagement and body stability on the tested surfaces. The 95 mm wheels performed much better on gravel, with less chassis contact and more reliable traction on small irregularities.
Qualitatively, the suspension works: wheels land independently at different elevations, and the body does not pitch dramatically when one or two wheels encounter an obstacle. What the test did not capture and should in future iterations includes the limits of suspension travel, the stiffness characteristics under load, and behaviour on terrain significantly rougher than what we used.
Distance Efficiency Test
Distance efficiency measures how much electrical energy it costs to move one meter. The formula for it is the total electrical energy input divided by the distance travelled, where electrical energy input is just current times voltage times time:
Where Effd is the distance efficiency (J/m), E(in) is the total input energy (J), d is the distance (m), I is the current (A), V is the voltage (V), and t is the time (s).
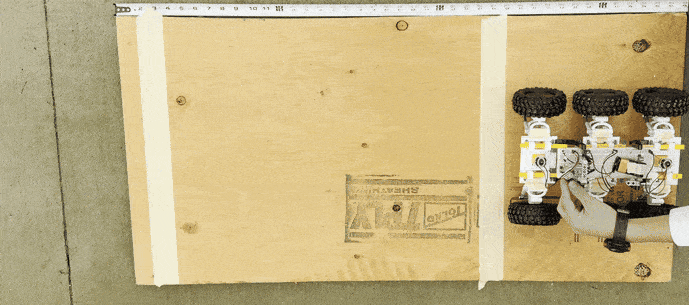
Test Design
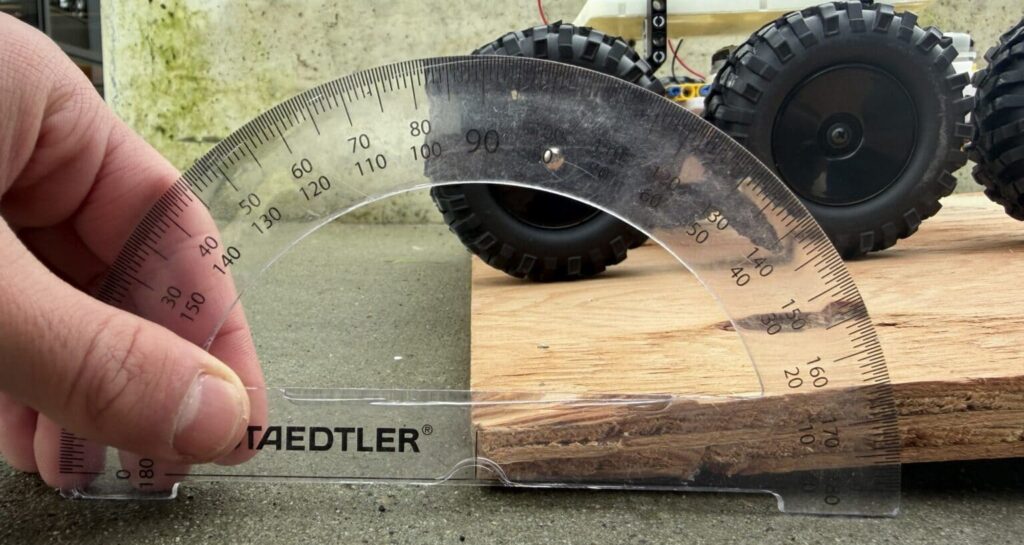
We set up a 0.65 m test distance on a wooden board and measured the voltage under load at 6.15 V with a current of 5.40 A. We then timed the rover across that distance for multiple trials on both flat and inclined surfaces, with the incline set at 6.5° from horizontal (a 7.4 cm rise).
Data Collection and Calculation
Flat Terrain (Base Scenario)
| Trial | Time (s) |
| 1 | 1.075 |
| 2 | 1.059 |
| 3 | 1.075 |
The average time across the three flat trials comes out to 1.070 s, which gives us:
Incline Scenario (7.4 cm rise, 6.5° from horizontal)
| Trial | Time (s) |
| 1 | 1.692 |
| 2 | 1.742 |
| 3 | 1.601 |
| 4 | 1.559 |
| 5 | 1.592 |
The average time across the five incline trials is 1.637 s, which gives us:
So the incline case used 53% more energy per meter than flat ground, since:
Energy Efficiency Test
While the distance efficiency test tells us the total cost of moving, this test asks a more specific question: of the extra electrical energy the rover used on the incline compared to flat ground, how much of that extra energy actually became useful gravitational potential energy?
Formulas
The useful energy output is the gravitational potential energy gained, which is mass times gravitational acceleration times height gained. The extra energy input is simply the difference between the incline energy and the flat energy. The energy efficiency is then the ratio of useful output to extra input:
Where m is the vehicle mass (0.930 kg), g is gravitational acceleration (9.81 m/s²), and Δh is the height gained (0.074 m).
Calculation
Plugging in the values:
So only about 3.6% of the extra energy actually went into gaining height, and the remaining 96.4% was lost to friction across the gearboxes, axles, universal joints, and wheel contact patches.
Analysis
The 53% increase in distance efficiency and 3.57% energy efficiency are both low, and they point to two things simultaneously: the prototype has significant drivetrain losses, and the test method has room for improvement.
On the testing side, a 0.65 m test distance means a small timing error of 0.05 s becomes a proportionally large error in calculated energy. Testing over longer distances (targeting 5 seconds or more of run time) would reduce that noise substantially. Measuring current continuously throughout each run rather than once at the start would also give a more accurate energy figure, since current may vary as the motor warms up or the battery voltage sags under load.
On the hardware side, friction is the main physical cause of the low efficiency, since the energy chain runs from battery → motor → gearbox → axle → universal joints → wheel, and every interface dissipates some energy as heat. With multiple layers of printed tolerances, LEGO connection flex, and hobby-grade motor gearboxes not optimised for efficiency, the cumulative losses end up being large. This was expected in principle, but the test quantified just how large it actually is: you need 100 J of input to gain 3.6 J of height.
Stage 5: What This Means for Proxima B
This is the part where the prototype data stops being about the prototype and starts being about the real mission. I now need to extend our test findings to estimate what a full-scale vehicle would actually need for a 10 km round trip on Proxima B, which requires scaling up both the mass and the energy numbers.
Scaling Up
The flat-case distance efficiency from our tests is 54.62 J/m, which equals 54.62 kJ/km. For a full-scale vehicle, I’m assuming it would be roughly 1000x the prototype mass, since the prototype weighs 0.930 kg and a real crewed rover would need to carry three astronauts plus shielding:
From there, I can calculate two mission scenarios using our measured efficiency data.
Scenario 1: Flat Surface
If the entire 10 km route were flat, the total energy required scales linearly:
Scenario 2: Mixed Terrain
A more realistic route would involve varied terrain, so I modelled it as one-third flat, one-third incline, and one-third decline. Since Proxima B has 1.3x Earth gravity, the incline efficiency needs to be gravity-scaled:
Then, averaging across the three terrain types and scaling up to vehicle mass gives:
Assumptions and Limitations of This Model
This scaling assumes energy scales linearly with mass, which is a simplification. In reality, larger vehicles benefit from proportionally more efficient drivetrains and larger wheels with lower rolling resistance per unit mass.
The model also only gravity-scales the incline case, but 1.3g would also increase rolling resistance on flat terrain, increase bearing loads, and require heavier structural members, which means the flat-case efficiency on Proxima B would be worse than what we measured on Earth. These factors push in opposite directions, but the net effect is that 198 kWh should be treated as a rough order-of-magnitude estimate rather than a precise figure.
I did not model air resistance, since Proxima B likely has little to no atmosphere. Even if some thin atmosphere existed, the rover would travel slowly enough on rough terrain that aerodynamic drag would be negligible.
What This Means for Power Source
At 150 Wh per kg of battery (which is roughly where current lithium-ion technology sits), the mixed-terrain scenario would require approximately 1,300 kg of batteries. That is significantly heavier than the vehicle itself, and it does not even account for the fact that carrying more battery adds to the total mass that needs to be moved, which then requires even more energy. I realise that this becomes a compounding problem.
The takeaway here is that pure battery power simply does not scale for this mission, which is the core argument for a higher-energy-density source. An RTG (radioisotope thermoelectric generator) is the realistic answer for a long-duration surface mission, and something we looked into a while back. This is because it trades chemical energy storage for nuclear decay heat with no moving parts, no recharge requirement, and continuous output across the mission lifetime.
I wanted to dig a bit deeper into current applications of this. I found that this is what Mars rovers like Curiosity and Perseverance use, for exactly the reason I mentioned. For context, Curiosity’s MMRTG outputs roughly 110 W continuously. If the rover travels at approximately 0.5 m/s on rough terrain, a 10 km trip takes around 5.6 hours and demands roughly 35 kW of average power, which is about 320 times what a single MMRTG provides. That gap illustrates why a Proxima B mission would need either multiple RTGs, a more efficient drivetrain, or both.
A Note on Waste Heat
Our energy efficiency test showed that only 3.57% of extra energy input became useful height gain, which means 96.4% was dissipated as heat through friction in the gearboxes, axles, universal joints, and wheel contact. On Earth, this is simply a loss. On Proxima B, with an ambient temperature around 250 K (−23°C) and no atmospheric convection, that waste heat becomes a dual problem: the drivetrain components risk overheating without convective cooling, but that same waste heat could potentially be redirected to keep electronics and the crew cabin warm. Thermal management on Proxima B is about shielding from the cold while also managing the heat your own vehicle generates.
Conclusion
Does the Prototype Meet the Definition Statement?
The definition statement asked for a vehicle capable of consistently and safely travelling a 10 km round trip on uneven, rocky terrain with inclines. The suspension test demonstrated consistent wheel contact and body stability across varied surfaces, which means the mobility requirement is met at the prototype scale. The energy tests, however, revealed that the drivetrain consumes 54.62 J/m on flat ground and 83.69 J/m on a 6.5° incline, with only 3.57% energy efficiency when climbing. Scaling those numbers to a full-size crewed vehicle produces an energy budget of 198 kWh for a mixed-terrain 10 km trip. I realise this figure rules out battery-only power. So the prototype meets the mobility half of the definition, but the energy data shows the drivetrain in its current form could not support a 10 km mission without a fundamentally different power source.
What I’d Improve: Design (Ranked by Impact, in my opinion)
I think the single highest-impact change would be adding bearings to every axle contact point and reducing the total number of drivetrain interfaces, since these directly attack the 96.4% energy loss that dominates the efficiency problem. Second, replacing 3D-printed structural parts with metal would solve the layer-line failures that broke components during assembly and testing. Third, increasing supply voltage carefully. For us, switching from 4.5 V to 9 V already produced a significant improvement, and the next step would need to account for motor and component ratings. I ranked these by how directly each one addresses the core problem the tests identified: friction loss is the biggest issue, structural failure is second, and voltage is an optimisation on top of those.
What I’d Improve: Testing
Run tests over longer distances to target at least 30 seconds of run time would really help. This would reduce timing noise dramatically, and help us understand more about our vehicle. Also, measuring current continuously applied rather than at a single point for a more accurate energy figure, since current may vary as the motor warms up or the battery voltage sags under load. Testing multiple incline angles and adding more declines would really help as well.
The Bigger Lesson
The bigger lesson is about what prototyping actually does. The CAD model was clean, but the real build exposed that universal joints cannot be 3D printed at hobby-printer resolution, that wheel diameter matters for ground clearance, that layer orientation matters for part strength, and that assembly tolerance is a real constraint that is not visible in the design file. The test data then showed that even a working drivetrain can be highly inefficient.
For Proxima B, the conclusion is that pure battery energy storage is not viable at mission scale, and we’ve concluded the vehicle needs either a far more efficient drivetrain or a fundamentally different power source. That is not a failure of this project, though. In fact, it is exactly the answer a prototype and energy calculation are supposed to produce. The prototype did not need to be efficient. It needed to produce data that constrains the real design, and it did.
AI Transcript
Here are ChatGPT instances I used to understand and help innovate off of our design:
https://chatgpt.com/share/6998b0f7-32b4-8010-9118-0398c0362cec
https://docs.google.com/document/d/1haFTUZTqk7KVnksyb8deygdtawCaPerfwY02cqDYHH8/edit?usp=sharing
Leave a Reply